10 States with the Worst Drivers [2025 Study]
The states with the worst drivers have high rates of fatal car accidents involving speeding, drunk driving, careless driving, and breaking traffic laws. New Mexico and Texas are some of the states with the worst drivers. Driver education and advanced vehicle technology may lower the risk in the states with the worst drivers.
Free Car Insurance Comparison
Compare Quotes From Top Companies and Save
![]() Secured with SHA-256 Encryption
Secured with SHA-256 Encryption
Brandon Frady
Licensed Insurance Agent
Brandon Frady has been a licensed insurance agent and insurance office manager since 2018. He has experience in ventures from retail to finance, working positions from cashier to management, but it wasn’t until Brandon started working in the insurance industry that he truly felt at home in his career. In his day-to-day interactions, he aims to live out his business philosophy in how he treats hi...
Licensed Insurance Agent
UPDATED: Oct 22, 2024
It’s all about you. We want to help you make the right coverage choices.
Advertiser Disclosure: We strive to help you make confident car insurance decisions. Comparison shopping should be easy. We are not affiliated with any one car insurance company and cannot guarantee quotes from any single company.
Our partnerships don’t influence our content. Our opinions are our own. To compare quotes from top car companies please enter your ZIP code above to use the free quote tool. The more quotes you compare, the more chances to save.
Editorial Guidelines: We are a free online resource for anyone interested in learning more about auto insurance. Our goal is to be an objective, third-party resource for everything auto insurance related. We update our site regularly, and all content is reviewed by auto insurance experts.
UPDATED: Oct 22, 2024
It’s all about you. We want to help you make the right coverage choices.
Advertiser Disclosure: We strive to help you make confident car insurance decisions. Comparison shopping should be easy. We are not affiliated with any one car insurance company and cannot guarantee quotes from any single company.
Our partnerships don’t influence our content. Our opinions are our own. To compare quotes from top car companies please enter your ZIP code above to use the free quote tool. The more quotes you compare, the more chances to save.
On This Page
Top 10 Deadliest Vehicles in History [#current_year]
You know them when you see them — swerving in and out of lanes, flying down the highway at 100 miles-per-hour, unaware of cyclists and pedestrians, driving erratically down the road. They are the worst drivers, and they pose a hazard to everyone on the road.
In this annual study of the 10 states with the worst drivers, we bring you the states that have the most of these dangerous drivers on the road.
 You may see your state or some of the states you’re suspicious of on the list. After our ranking of the 10 worst states, we’ll break them down by individual categories. Unsafe driving behaviors pose a threat to the safety of you and other drivers on the road.
It can also severely impact your car insurance rates. Car insurance with a bad driving record, including accidents and other violations, can be much more expensive than a clean record. Ready to dive into the states with the worst drivers? Let’s get started.
- On average, the death rate in the 10 states with the worst drivers is 1.34 per 100 million vehicle miles traveled
- There are no states in the Northeast region of the U.S. in the top 10
- Drivers should consider taking a driving course to brush up on safe driving habits
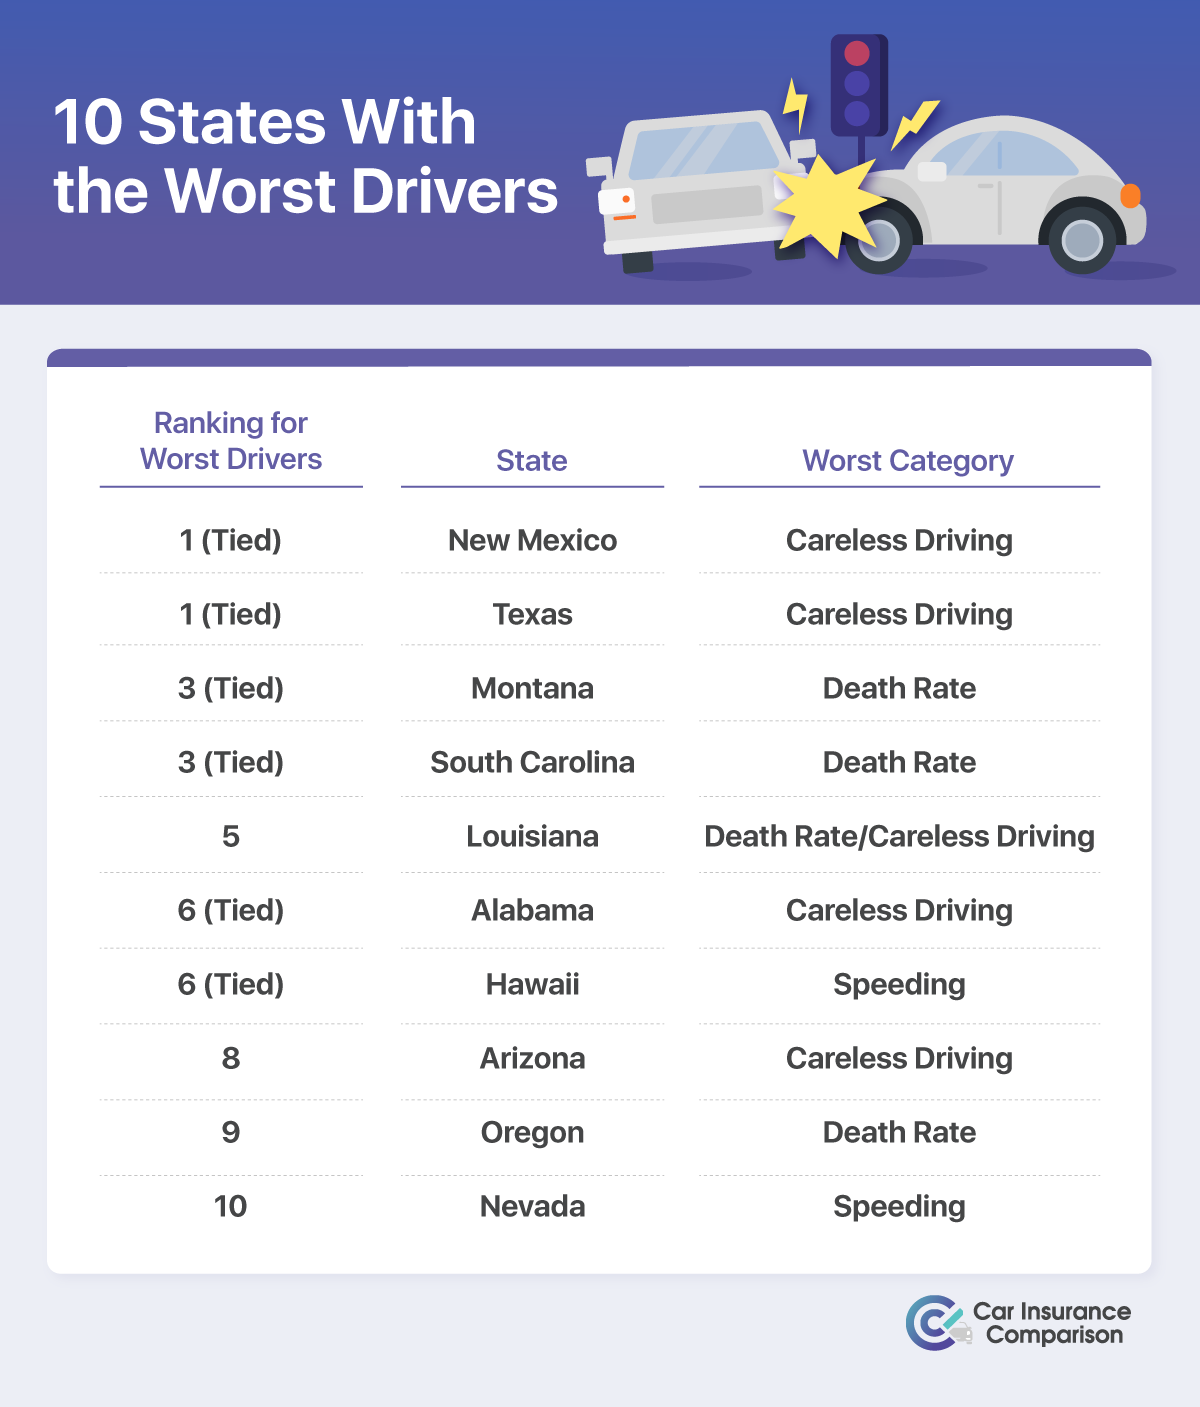
10 States With the Most Deadly Drivers
From the North to the South, the East to the West, here are the 10 states with the worst drivers. You’ll find some of the usual suspects that have appeared on this list multiple times, but some might surprise you. Our researchers analyzed the five bad driving behavior categories:
- Car accident death rate
- Failure to obey traffic laws
- Careless driving
- Drunk driving
- Speeding
These categories contributed to each state’s ranking for the worst drivers. At the end of the article, we include an overall ranking of all 50 states. If yours isn’t in the worst 10, you can still find out how drivers in your state ranks. After all, bragging rights are important, no? Scroll down to start our ranking of the 10 states with the worst drivers:
Read more: The Worst Drivers in the World Ranked By City
#10 – Nevada
Nevada landed the 10th spot on our ranking. The category in which Nevada drivers scored the worst is speeding, followed by careless driving. Nearly 29% of all fatal accidents in Nevada involved at least one driver who was speeding.
Our careless driving category looks at pedestrian and cyclist death rates. In Nevada, the pedestrian death rate was 2.01 per capita (per 100,000 population), and the cyclist death rate was 0.26.
#9 – Oregon
Oregon ranks ninth in this list of the 10 states with the worst drivers. Its top two worst categories were overall car accident death rate and speeding. For the category of death rate, 1.36 people died in traffic incidents in Oregon for every 100 million miles traveled. Additionally, just over 28% of all fatal accidents in Oregon during our study period involved speeding.
#8 – Arizona
Arizona ranks eighth for states with the worst drivers across the country. The two worst categories for drivers in the state were careless driving and death rate. Regarding careless driving, the pedestrian death rate per capita was 2.91.
The cyclist death rate per capita was 0.41. The state’s overall car accident death rate was 1.4 deaths for every 100 million miles driven during our study period.
#6 (tied) – Hawaii
Hawaii tied for sixth in this ranking of the states with the worst drivers. The worst categories for Hawaii were speeding and careless driving. Hawaii is one of the worst states for speeding-related fatal car accidents. In fact, just over 48% of fatal accidents in Hawaii involved speeding.
Hawaii had the highest percentage of speeding-related fatal accidents out of the top 10 states. It’s also the second-worst out of all 50 U.S. states. In the category of careless driving, the fatality rate of pedestrians was 2.36 per capita and .28 for cyclists.
#6 (tied) – Alabama
The second half of the tie for the sixth spot is Alabama. The state scored the worst in careless driving, and the second worst was the death rate. Alabama’s pedestrian fatality rate was 2.36 per capita, and the cyclist fatality rate was 0.12. The overall death rate in the state was 1.29 per 100 million vehicle miles traveled.
#5 – Louisiana
Landing in the fifth spot on our worst drivers ranking is Louisiana. The death rate and careless driving categories tied for Louisiana’s worst categories. Louisiana’s overall car accident death rate was 1.43 per 100 million vehicle miles traveled. For careless driving, Louisiana’s pedestrian death rate was 2.54 per capita, and the cyclist death rate was 0.47 per capita.
#3 (tied) – South Carolina
We have another tie in the ranking, with South Carolina and Montana vying for the top three. South Carolina’s worst category was the death rate, and there was a tie for the second-worst between careless driving and speeding. The car accident death rate in South Carolina was 1.73, the worst out of all 50 states.
When looking into the careless driving category, South Carolina had the worst cyclist death rate out of these 10 states at 0.50. Its pedestrian death rate was 3.11. Speeding is another issue in South Carolina. Out of all fatal accidents in the state, 45.85% involved speeding. That is the second-highest percentage out of the top 10 states.
#3 (tied) – Montana
Like South Carolina, Montana’s worst categories were death rate and speeding. Montana’s car accident death rate was 1.42 per 100 million vehicle miles traveled. For speeding, 30.98% of all fatal accidents involved at least one driver who was speeding.
Beyond those two categories, Montana had the worst rate of fatal crashes involving at least one driver without a seat belt. That is the second-worst among all 50 states.
#1 (tied) – Texas
We have a tie for our number one state with the worst drivers between Texas and New Mexico. In Texas, the worst category was careless driving, followed by speeding.
In the careless driving category, Texas’s pedestrian death rate per capita was 2.24. The cyclist death rate per capita was 0.23. Out of all fatal car accidents, 30.71% involved speeding.
Additionally, Texas didn’t score well in the failure to obey or drunk driving categories. Texas had the highest percentage of fatal car accidents involving a driver with an invalid driver’s license, with 19.1%. It also had the highest rate of alcohol-related fatal accidents among these 10 states, with 79.56% involving alcohol.
#1 (tied) – New Mexico
Finally, the second half of the tie for the state with the worst drivers is New Mexico. The category in which New Mexico scored the worst was careless driving, followed by the car accident death rate. Overall, New Mexico ranked the worst in the careless driving category out of all 50 states in the U.S.
In fact, New Mexico ranked as the number one most dangerous state for pedestrians. Its pedestrian fatality rate was the worst in the country, at 3.96 per capita. New Mexico’s cyclist death rate was 0.43 per capita. The overall car accident death rate in New Mexico was 1.51 per 100 million vehicle miles traveled.
Read more: Top 10 Deadliest Vehicles in History
Free Car Insurance Comparison
Enter your ZIP code below to view companies that have cheap car insurance rates.
![]() Secured with SHA-256 Encryption
Secured with SHA-256 Encryption
10 Worst States by Dangerous Driving Category
Now that you’ve seen the 10 states with the worst drivers, it’s time to lump them all together and look at all 10 in each category.
In the graphic below, you’ll see the statistics for all 10 worst states in the category: death rate.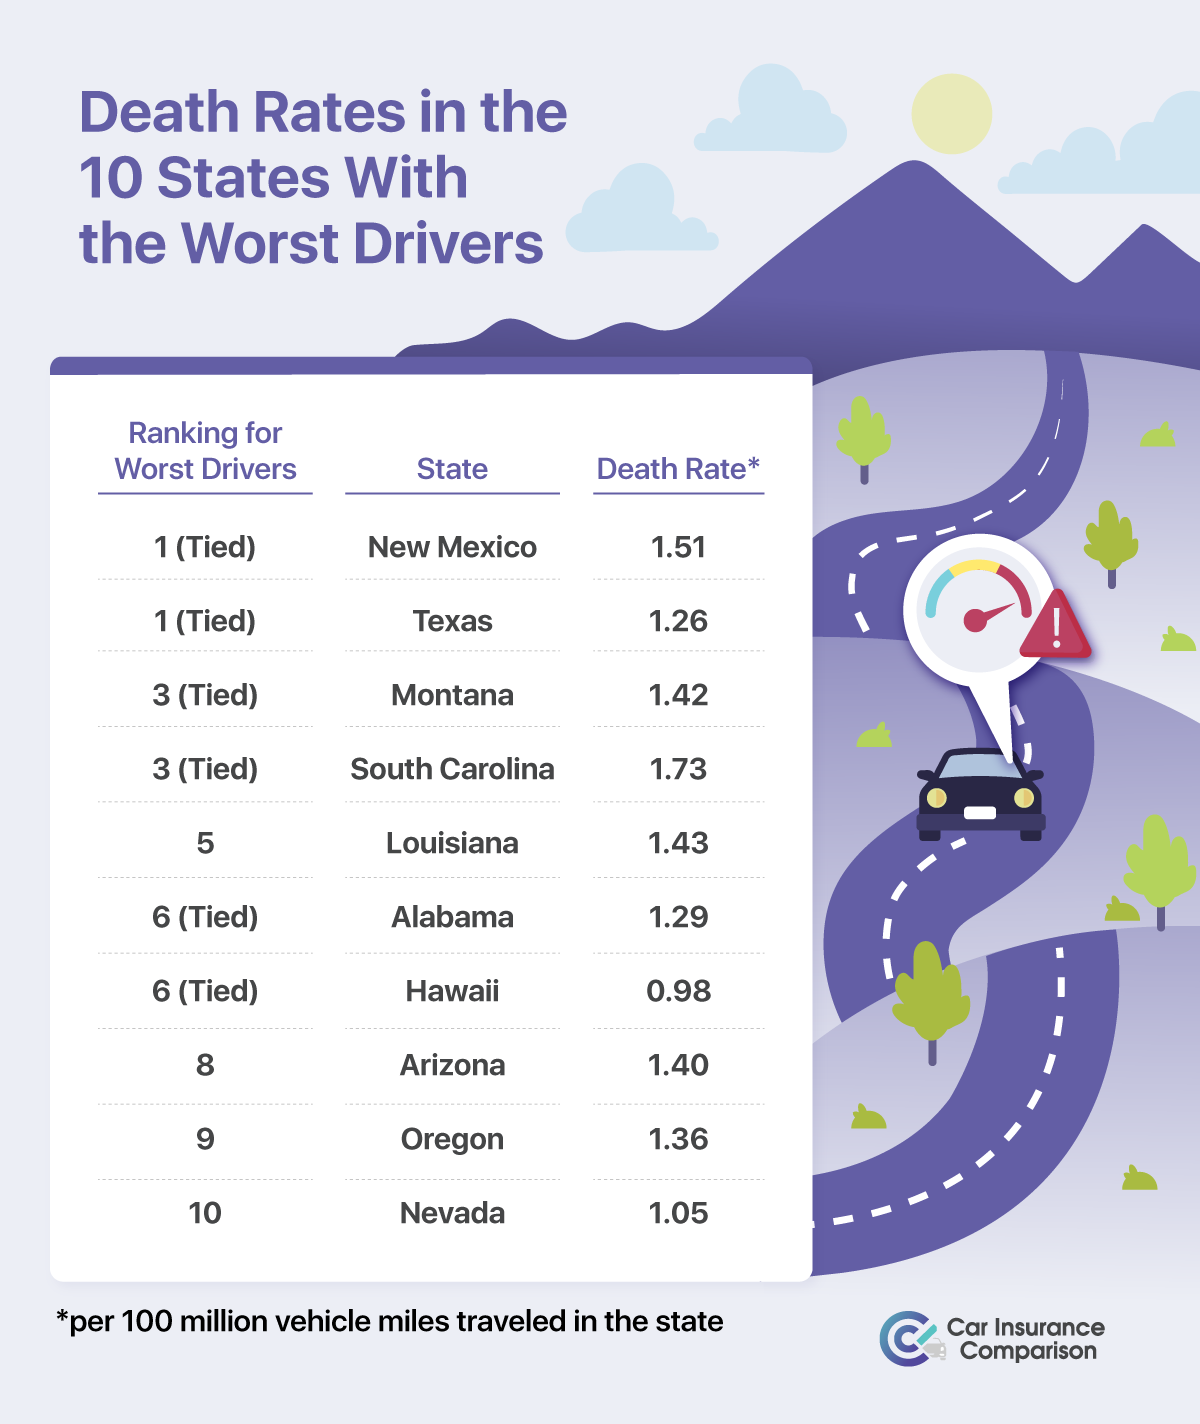
All but one state has death rates of one person killed per 100 million miles driven or higher. South Carolina is the worst, with a death rate of 1.73, and New Mexico ranks second-worst in this category, with a death rate of 1.53 people killed per 100 million miles driven.
The following graphic shows all 10 states and their statistics for failure to obey traffic laws.
The failure to obey category had three subcategories: when a traffic safety device was involved (i.e., traffic sign, signal, or officer), not wearing a safety restraint, and involving an invalidly licensed driver.
Nevada is the worst in the first subcategory, with 5.84% of its fatal crashes involving a traffic safety device. Montana is the worst in crashes when someone isn’t wearing a seat belt, and Texas is the worst in crashes involving an invalidly licensed driver.
Traffic laws include the basic safety rules that all drivers should follow. These rules are often taught in drivers’ education courses, but drivers often neglect them, leading to serious accidents.
Robert Johnson, the founder of Sawinery.net, said, “Safety rules and regulations should be regularly reiterated to drivers until compliance becomes a habit. Monitoring is also an important part of this endeavor as it’s a way to ensure everyone’s cooperation.”
“Being a reasonable and responsible driver necessitates a set of knowledge, skill, and attitude. First, you must be familiar with traffic laws and safe driving practices. The most common cause of collisions is violating these ‘rules of the road,’” Johnson added.
The following graphic shows all 10 states and their statistics for careless driving.
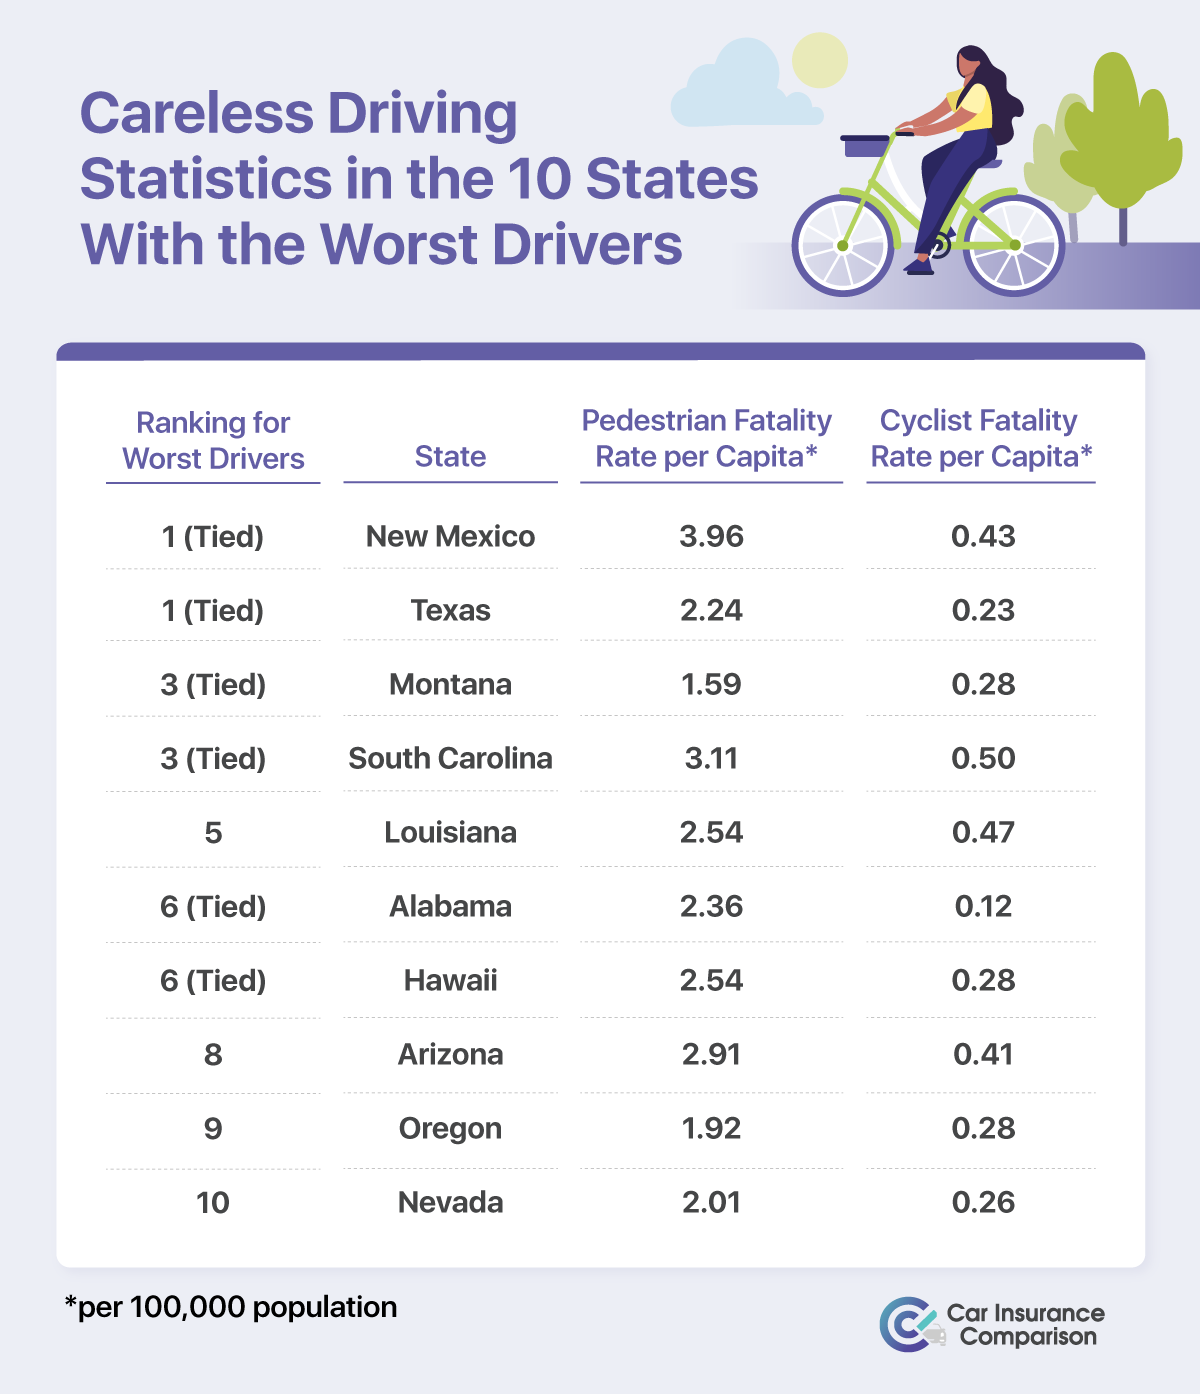 The careless driving category was divided into two statistics: pedestrian death rate per 100,000 people and cyclist death rate per 100,000 people. New Mexico is the worst state in the pedestrian fatality category, and South Carolina is the worst state in the cyclist fatality category.
The graphic below shows the 10 worst states and their statistics in the category of drunk driving.Our researchers divided the category of drunk driving into two separate statistics: drunk driving deaths where at least one driver had a BAC of .08 or above and deaths when at least one driver had a BAC between .01 and .07. Texas was by far the worst overall.
Drivers caught operating their vehicle under the influence of alcohol, with a BAC above the legal limit, will be issued a DUI and could also have their license suspended. Car insurance rates after a DUI can be extremely high for a long period of time. If your license is suspended, you will have additional requirements to fulfill before you can get back on the road.
Drunk driving is a very serious offense and extremely dangerous. Beyond increased car insurance rates, violators may have other expenses, including education courses and fines. The last graphic shows the 10 worst states and their statistics for speeding.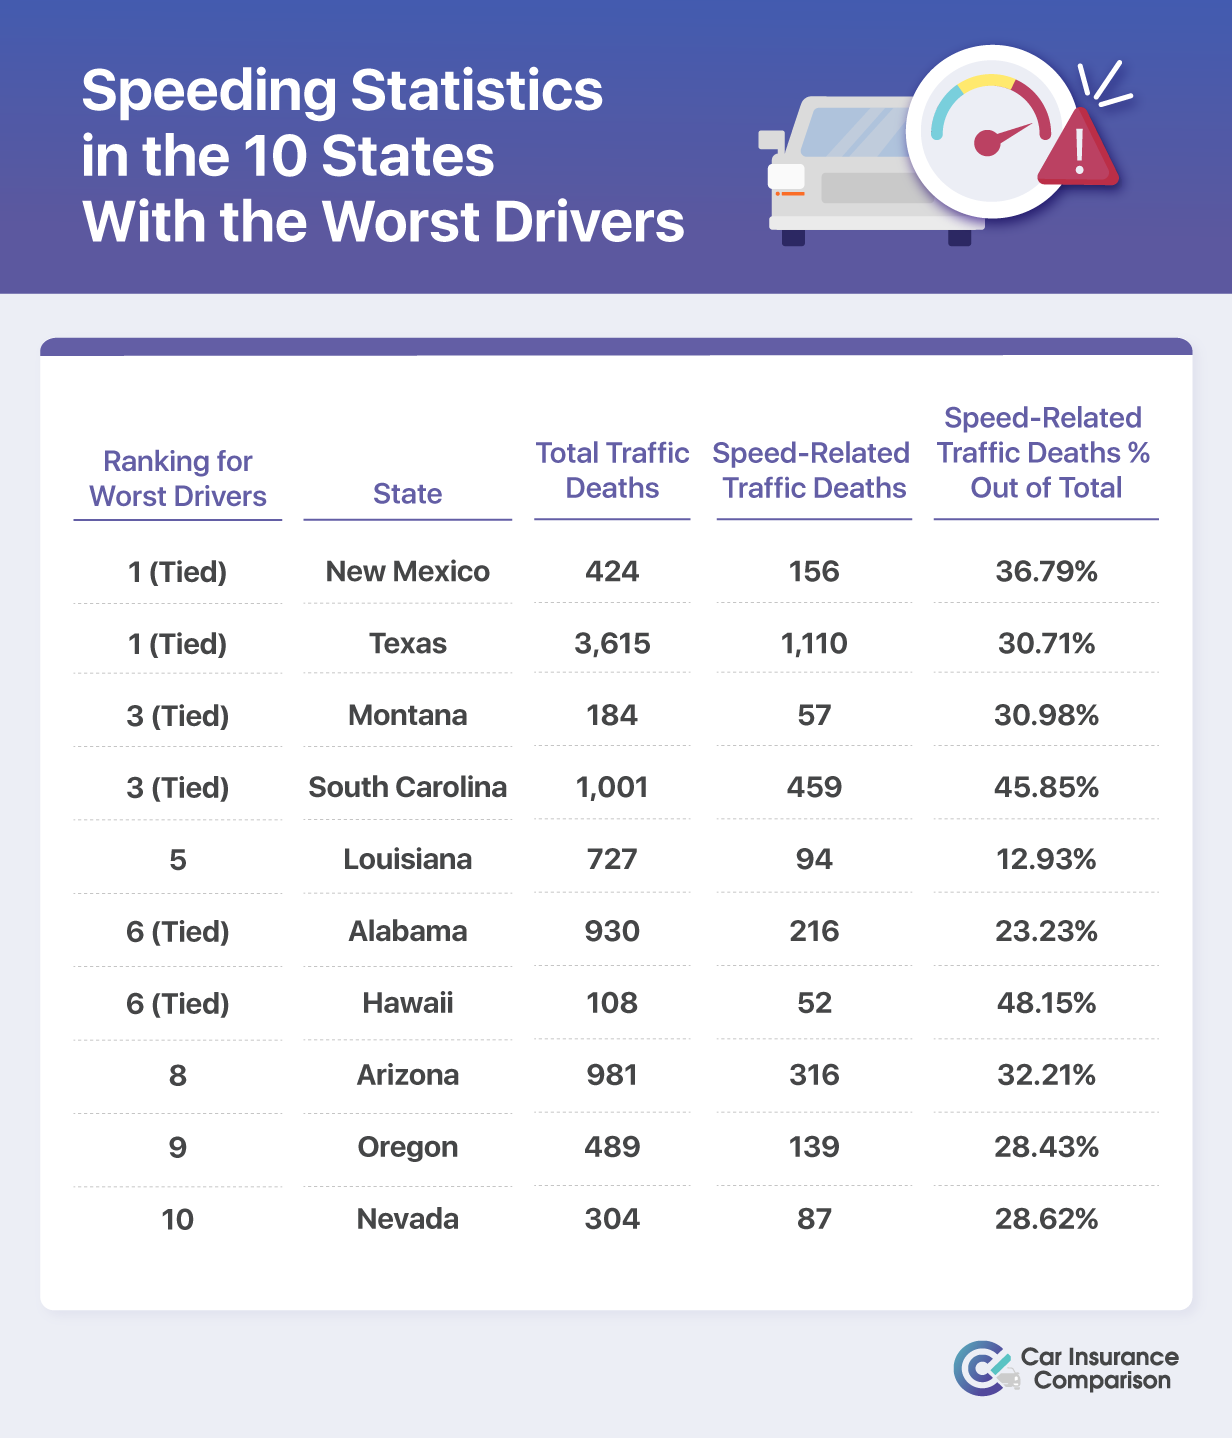 Hawaii is the worst state for speeding among the 10 states, with 48% of its fatal crashes involving a speeding driver. South Carolina is a close second, with 46% of its fatal crashes involving a speeding driver.
When you speed, you have a shorter reaction time to avoid serious accidents. Drivers should make sure to follow the posted speed limits. Additionally, if you are driving in bad weather, make sure to lower your speed, even if it is below the speed limit.
Thought Leaders Share Insight Into Bad Driving
We’ve all encountered unsafe drivers, but what can we do to improve driving habits and make the roads safer? Experts on the subject shared their thoughts and advice with us, including personal experiences with bad drivers.
Read on to see insights from frequent travelers, delivery drivers, car accident lawyers, business owners, business consultants, and more. “The #1 reason for car accidents in the U.S. is distracted driving, especially now, during the 21st century. It is hard for drivers to stay focused on the road when their phones are in front of them.
While it is the driver’s responsibility to keep others safe on the road and not drive distractedly, certain factors would help all drivers, including fixing roads.
In the area of D.C., where our law firm is located, the roads are awful. That’s due to the weather conditions we face. Because of the snow and mostly ice, roads deteriorate so quickly. With the new infrastructure bill, drivers may not have to worry about as many potholes and can have a safer drive, that is if they are not distracted.
Regardless of whether or not roads and bridges are fixed, that doesn’t eliminate distracted drivers. The infrastructure bill could put billions of dollars into creating perfect roads. However, it doesn’t end there. No matter how perfect the road is, accidents can still happen if a driver is not paying attention.
If you’re driving and you are always tempted to look at your phone or text/call someone back, I suggest putting your phone away where you can’t see it.
You can put your phone in a bag or in the back seat or just turn it off altogether. If someone is riding with you, have them answer the text or check your phone.
However, if you need your phone for directions, the best thing to do is to turn off your notifications when you drive. That way, you can focus on where you are going rather than who is contacting you. It’s up to all of us to contribute to the safety of others on the road.”

Seann Malloy is the founder of Malloy-Law.com.
As a personal injury lawyer, he has represented many car accident victims.
What are the most common bad driving habits that you’ve noticed when driving?
“Tailgating: Tailing too closely is one of the most dangerous things you can do while driving. The driver in front of you could brake hard at any moment, causing you to rear-end them. It’s also one of the easiest bad habits to correct — simply leave a safety margin.
Driving too slowly: In rush hour traffic, it can be tempting to get in the left lane and creep along at 25 mph. It might be safer than sitting through multiple lights, but if everyone else is doing 50 mph, that’s going to frustrate everyone around you. The faster cars will try to pass you on both sides, potentially causing a chain reaction of accidents.”
What can local, state, or federal government do to reduce fatal crashes?
“Local traffic enforcement is responsible for issuing citations to those convicted of violating traffic laws. Thus, it is logical that local governments support efforts to reduce the number of fatal crashes by enforcing the laws against the primary causes of these accidents: speeding, drunk driving, and failure to wear seat belts.
The state and federal governments provide funding for highway safety programs such as drunk driving education in an effort to reduce the number of fatalities. These agencies also offer grants and incentives to local governments to reduce alcohol-related fatalities through enhanced enforcement and education programs.
While traffic enforcement agencies have successfully reduced the number of fatal car accidents, much work remains to be done before reaching zero fatalities. Traffic enforcement officers can continue to work with their state legislators in support of programs that increase public awareness about traffic safety issues.
The ultimate goal should be zero fatalities through increased public awareness about safe driving practices.”

Mario Cacciottolo is the head of PR for SBO.net.
He is a former BBC reporter who loves to travel.
“I am a part-time delivery driver in the South Florida area, specifically Palm Beach Gardens. I’ve lived and visited quite a few places around the country and the world but have never come across worse drivers than here in South Florida. It is very dangerous to drive here, and you definitely have to be a very defensive driver.
Since the traffic lights generally are pretty long, one of the worst bad habits of drivers here is blatantly running red lights. It is not even a close call, they completely run the red lights, and it happens all of the time.
Extreme speeding is another huge problem, as well as aggressive driving, cutting people off, stopping in the middle of the road, cutting across multiple lanes, u-turning on a red light, excessive honking, going straight from turn-only lanes, turning left in front of people driving straight, and probably a lot more.
A few ways communities across South Florida should be working towards fixing these problems include ticketing way more people and promoting kindness while driving. People, at least some, would stop breaking the law over and over if they continued to get ticketed.
Accidents, hit-and-runs, and pedestrian collisions are very common, but even these situations don’t seem to deter anyone from driving the way they do. They need to be held accountable for the way they are driving before it turns violent or deadly.
In addition to more police action, we need to learn how to be kind and patient while driving. Everyone is always in such a hurry, no one ever wants to let you in ahead of them even if you have your blinker on, and horn honking is constant for no reason sometimes.
If people could learn how to be kind to others while driving and take their and others’ safety more seriously, it would change things for the better.
I have experienced so many bad drivers on the road in just a short year and a half of living here in South Florida. It happens a minimum of 5 times every time you leave your house.
The way everyone drives started to turn me into an angry and aggressive driver, but after so much stress and irritation while driving, I realized that I just have to calm down and take my time on the road.
It is unnecessary to run a red light to save four minutes or not to let someone in because you don’t want them to get in front of you. It’s ridiculous that this is a normal thing here, and I had to get back to the way I learned how to drive like a polite and kind Texan for my own safety and sanity.
It’s really appalling that people care so little about themselves and others, and something definitely needs to change. I hope people can learn that they are not driving in a fast and furious movie and that safety is more important than saving a few minutes of time on the road.”
Haley Sauls is a delivery driver with Fernweh Foreigner.
Fernweh Foreigner features allergy-friendly recipes for traveling.
What are some ways in which drivers can improve their driving skills?
“Drivers can improve their skills by going back to the basics. Remember all those rules you learned for your driving test? Signaling at every turn, even in reverse, and coming to a complete stop at stop signs are some simple things that drivers often forget. But you need to know that these are the laws.
Therefore, practicing these basic rules as the years pass (even if you’re a pro) is important. Make sure to signal every time you change lanes. Do not cut the corner when turning right; instead, make the complete turn. Although these things might seem small, they’re essential to improving your skills and becoming a better driver.”
What are the most common bad driving habits you’ve noticed when driving?
“The most common bad driving habit I’ve noticed is when people use their mobile phones while driving. I agree that the constant ping of an incoming message is very distracting. But it’s essential to keep your eyes on the road. Your phone can wait! If you don’t do this, you’re putting yourself and others in danger.
A good trick is to put your mobile on airplane mode. This way, you won’t be disturbed by random messages and calls while you drive. One might think that wearing a seatbelt is the norm. But the number of people I’ve seen who don’t buckle up is shocking. People tend to avoid wearing a seatbelt if they aren’t driving for long distances, for instance, they’re going to a local store just a block away.
But you must remember that accidents don’t knock on your door before entering. So, it’s very important to wear a belt and ensure it’s properly buckled up. After all, it’s better to be safe than sorry.”

David Clelland is the founder of Infiniti Tracking.
His company specializes in vehicle tracking.
What are some ways in which drivers can improve their driving skills?
“Don’t forget about the importance of signaling every turn. This habit saves you and others on the road from deadly accidents. Additionally, follow the painted boundary line instead of being blinded by the high beams of an approaching car at night.
Maintain a distance of 4 seconds from the other vehicles, front, and back. Use your two eyes as a revolving mirror. Instead of just looking straight ahead, check your rearview mirror frequently.”
What are the most common bad driving habits you’ve noticed when driving?
“Being impatient and accelerating through the yellow lights may cause a deadly collision.
Becoming deafened due to headphones or mobile phones and losing the ability to respond immediately can lead you to a serious accident. Driving needs full attentive senses.
Tailgating is the most common bad habit. It often results in minor crashes before a major one occurs. Therefore, avoid following the car in front of you too closely.”
Are there ways that you think communities can do better at helping to keep the roads safer?
“Yes, I think they can help to keep the roads safer by considering some important tips. It’s better to be late than to get into an accident. Always follow the speed limit. It takes a small effort to put a signal before turning or making a U-turn, so be sure to signal.
Improve visibility on the roads. Appropriate headlights and road lighting can decrease the risk of accidents in low-visibility areas.”
What can local, state, or federal government do to reduce fatal crashes?
“Run campaigns to raise awareness through electronic and print media about driving and traffic rules. Work on safer road infrastructure, including the promotion of automated vehicles.
Tighten car safety rules, such as mandatory use of seat belts, prohibit the use of mobile phones while driving, and encourage the installation of anti-lock brake systems.”
Why do some areas have worse drivers than others?
“As per my observation, I concluded that this is because of the young generation’s immaturity, negligence, and unawareness of proper driving rules. Those areas with no proper driving guidance and schooling have worsened drivers.”
Will the new infrastructure bill make driving safer, and if so, how?
“In my opinion, new infrastructure will definitely contribute a lot to making driving safer. It is because they have introduced improved car safety features such as drunk-driving prevention technology, rear seat alerts, more protective hoods and bumpers, and anti-glare headlights.”

Ryan Yount is the COO of LuckLuckGo.com.
His app allows users to change their GPS location.
“Distracted driving, which claimed 3,142 lives in 2019, is any activity that diverts attention from driving. When operating a vehicle, the only task you should focus on is driving.
One of the main distractions drivers face today is eating and drinking. One sip of water while behind the wheel means you’re removing your hand from the wheel and tilting your head back — both of which could have deadly consequences. Instead, consider using chewing gum or hard candy while driving. If you need to eat or drink something, stop in a safe area to do so.
We all need a refresher on proper driving etiquette from time to time. If you ever take someone with a permit out to practice driving, they will probably bring up some rules or practices you forgot about over time. Some of the most common bad driving habits that I see happen during snowy or icy weather conditions.
Even in places with harsh weather conditions every year, there is always a spike in accidents and slide-offs when the first snow falls.
People forget the importance of driving slower and putting a greater distance between themselves and the car in front of them. You can’t always see ice, and if you don’t give yourself space to stop when the roads are icy, it doesn’t take much to slide into the person ahead of you and start a larger pileup.
States and local communities should put effort into creating ads, commercials, and social media posts about the importance of changing your driving habits during the winter before the weather turns for the worst. Simply reminding people of the necessary modifications can help reduce the number of accidents.
People don’t usually mean to be reckless; they often just forget to be more careful. I think it might also be beneficial for local law enforcement to offer courses on winter driving for people who are not used to it.
For example, suppose a person grew up in Southern California but recently moved to Montana. In that case, they will be out on the winter roads with no practice, experience, or knowledge of what to do. Not only is this dangerous, but it can cause a lot of anxiety for the driver, so a course might make a huge difference.
Drivers can improve their driving skills by taking adult driving lessons and defensive driving courses.
There is a common misconception that these types of programs are only for people with little to no prior driving experience. In truth, they can be extremely helpful for people who never took formal driving training (but have experience) or people who simply wish to polish their skills.
I think the worst habit you can have while driving is texting. It’s an insidious form of distracted driving because people think they can glance down at their phones without causing a crisis, but it only takes a few seconds to cause a huge accident.
One way communities can keep the roads safer is by beefing up their signage. Many places, especially rural areas, lack signage that can be hard to read or interpret, especially in inclement weather. Making signs bigger and easier to read is beneficial to everyone.”

Kyle MacDonald is the Director of Operations at ForcebyMojio.com.
Force by Mojio provides GPS fleet tracking for small businesses.
What are the most common bad driving habits that you’ve noticed when driving?
“Tailgating — This is a problem for everyone in every state, but especially for drivers in California. If you aren’t familiar with the ‘California stop,’ it’s where a driver doesn’t come to a complete stop at a stop sign or intersection (simply slowing down instead) and then proceeds through after the light has turned green.
So, if someone is tailgating me in the left lane, they will continue moving forward even though I’ve come to a complete stop at the red light. That’s pretty dangerous and incredibly annoying. There should be no reason why someone can’t wait 10 seconds for me to finish stopping before they start driving again.”
What can local, state, or federal government do to reduce fatal crashes?
“The most effective strategy is to get more people to drive cars that are equipped with features that can prevent these accidents from happening in the first place. For example, electronic stability control (ESC) helps drivers maintain control of their vehicles on curves and slippery roads.
Another life-saving feature is forward collision warning, which alerts drivers when they’re about to rear-end the car ahead of them. These technologies are already available. But only about half of new cars have them as standard equipment. More than 85% of 2012 models had rearview cameras, which help drivers avoid backing over children or other objects behind them.
Tougher law enforcement policies on drunk driving can also reduce fatal crashes, the report says. Some state and local governments have been working to address the problem by looking at their own employees’ driving records, for example, or those of contractors.
In some cases, the report’s authors say there’s evidence that certain strategies work because they change people’s behavior more generally, not just while they are behind the wheel.”
Are there ways that you think communities can do better at helping to keep the roads safer?
“Don’t drive distracted: It’s hard to quantify how many accidents are caused by someone talking or texting on a cell phone. But we do know that even hands-free devices like Bluetooth or voice-activated apps can be distracting, so don’t use them while you’re driving.
Don’t speed: Speeding increases your chances of having an accident and hurting someone else or yourself.”
Why do some areas have worse drivers than others?
“The unfortunate reality is that many factors can affect how accident-prone an area is. Some of these are not controllable by drivers (like weather), but some are (like driver behavior). The best way to understand this is to look at the statistics of car crashes in different areas. The following are the most common reasons for car accidents:
Speeding: Speeding is dangerous regardless of where you do it, but some states have more lenient laws than others regarding speeding tickets.
For example, if you get caught speeding while driving through Arizona, there’s a very good chance that you’re going to get pulled over. However, if you’re caught speeding in Nevada, the chances go way down. Why? Nevada has very lax laws when it comes to speeding tickets and fines, making it one of the easiest places in the country to speed.
Busy roads and intersections: There’s no way around this one — if there are more cars on the road than there should be at any given time, there are likely going to be more accidents.”

Will Hatton is the founder of TheBrokeBackpacker.com.
Will has been traveling on a budget for over nine years.
What are the most common bad driving habits you’ve noticed when driving?
“I’m sure you have your own list, but here are some things my family and I noticed while on a road trip this summer:
Some drivers don’t turn on their headlights until they’re behind you. It’s a good idea to use your headlights when it’s raining or when there are foggy conditions, but I don’t think it’s a good idea to wait until you’re about to run into someone before turning them on.
Then some drivers can’t seem to merge onto the highway at the speed limit. They drive up alongside you and then suddenly speed up to get ahead of you. I think that if someone is going 70 mph on the highway, they should be able to get over in the next lane without speeding up.”
Why do some areas have worse drivers than others?
“To be honest, there is no need for you to worry about being nervous when driving in a new place. You will see the difference after knowing the reasons why some areas have worse drivers than others.
The most important factor is education. Some people are not educated enough when they are young, becoming bad drivers when they grow up. They do not know all the driving rules and cannot pay attention to all the road conditions at once.
Many things can distract drivers, too, like traffic jams and other people’s driving styles. So they will always ignore these factors while they are concentrating on one thing only in their mind.”

Kamyar Shah is the COO of KamyarShah.com.
He is a business consultant with over 20 years of experience.
The States With the Worst Drivers
“It’s no secret that there are some terrible drivers on the road. But which states have the worst drivers?
When it comes to driving, many people would say there is no such thing as the best or worst drivers. However, when it comes to countries, some tend to be worse than others. It seems that many of the states in the United States are among those with the worst drivers.
Some of these states include Arkansas, Louisiana, Mississippi, and Oklahoma. These states have consistently been ranked as the worst in traffic fatalities.
In fact, over a third of all traffic fatalities in the US occur in just five states: California, Florida, Illinois, Texas, and Oklahoma. This is mainly due to their high car accidents and drunk driving rates.
Interestingly enough, some other countries also have a high number of traffic fatalities. For example, Russia has a rate of 38 deaths per 100 thousand population, while Germany has a rate of only 18 deaths per 100 thousand population. However, Russia has a much higher rate of car accidents and drunk driving than any other country on this list.”
What makes a good driver?
“Many things make a good driver, but the most important qualities are patience, attentiveness, and a good sense of direction.
It is also essential to handle stressful situations calmly and safely. Drivers with these skills can often avoid causing accidents or causing inconvenience to other drivers.”
How do you become a good driver?
“Becoming a good driver is not easy. There are many things that you have to learn, and there are many things that you have to do. Remaining patient is one of the most important things that you can do.
It would also help if you remembered that everyone else on the road is trying to get somewhere, and they may not be as experienced as you are. You need to be aware of your surroundings at all times and know what traffic patterns exist in the area where you live or work. If you can do all these things, you will become a good driver.
Whether you’re a new driver or just looking to improve your skills, there are some great tips. Follow these tips, and you’ll be a safe and responsible driver.”

Anup Kayastha is the owner of AutoLoanCalculator.net.
He studies crash stats and other factors that increase interest rates.
“First of all, there are critical distinctions amongst bad drivers: Some bad drivers are rude or enraged. Some bad drivers are in a hurry for fear of losing their job or missing an appointment.
Some bad drivers simply do not know where they are going; many are merely tourists or perhaps newly relocated to the area and not accustomed to local roadways, driving norms, and how different cities and towns are designed for drivers.
However, most bad drivers are fundamentally unskilled at properly piloting a vehicle. Bad drivers may have never been trained to operate their vehicle expertly at high speeds under varying roadway or weather conditions (not for racing but for reaction time training).”
What are some ways in which drivers can improve their driving skills?
“Private driving courses that offer expert training are the very best ways to overcome the fear of driving and to advance your expert driving skills. Learning to use modern GPS and other technology that comes standard in today’s vehicles is another way American drivers can improve their ‘piloting skills.’
Sadly, self-driving vehicles and any such trendy technology may encourage bad driving habits as people rely on their vehicle to do the thinking for them.”
What are the most common bad driving habits that you’ve noticed when driving?
“Hand-held phones, hand-held phones, and hand-held phones. Excellent driving requires both hands on the wheel, eyes facing forward out of your windshield or into your rearview mirrors at all times.
Paying close attention to actual potholes, curbs, and what other drivers are doing in front of you and behind you are skills taught in advanced driving experiences and racetrack simulation driving courses, especially at speeds slightly higher than normal.
Racecar drivers are so good at street driving because they are trained to think and react to even the slightest movement or debris on the racetrack to avoid horrific crashes.
I’m not suggesting drivers take to their local streets to race, yet considering more advanced training courses or even computerized simulation training at higher speeds can help bad drivers become more alert drivers.”
Are there ways that you think communities can do better at helping to keep the roads safer?
“Communities can do a better job of deploying public service messaging consistently to encourage drivers to put their phones down, use their blinkers, be courteous to other drivers, and operate their vehicles better. Some examples are billboards, radio and DJ announcements, cable TV ads, official public statements, and especially modern roadway signage.
This is especially important in popular cities and towns where tourists and snowbirds flock seasonally. Again, more advanced training courses and computerized simulation driver education at higher speeds or in more localized conditions would help bad drivers become more alert and far more competent at piloting their vehicles.”
What can local, state, or federal government do to reduce fatal crashes?
“In every legal, accounting, or real estate profession, continuing education is required to maintain the right to hold a license. Well, in my expert view, every local, state, and federal government entity could reduce fatalities tenfold by requiring drivers to complete more intelligent upgrades to their licensing privileges every five to 10 years.
Going forward, driving tests should include how to operate your vehicle’s GPS system, how to drive in inclement weather or on poorly maintained roads, and how to spot other drivers who are texting or driving poorly.
The answer is not stiffer penalties or higher fines, but rather more exciting, fun, and engaging driver education and better roadway communication (signs/alerts/graphics).”
Have you experienced a bad driver on the road? What did you learn from that experience?
“Yes, many times. Approximately 80% of my bad driver experiences these days have been due to hand-held phones either as texting or talking devices or as GPS devices. When driving, my wife is always the GPS navigator, and I am the expert driver focusing 100% on the road and piloting our vehicle.
We always use our hand-free earbuds when either of us ever has to take a work call while driving. The secret to great driving is having both hands on the wheel and both eyes on the road or your mirrors.”
”Why do some areas have worse drivers than others?
“Seasonal or tourist locations may have bad drivers who do not know their way around or the nuances of the local roadways and traffic signals.
People who live in remote or rural towns all year are typically very cautious and courteous to other drivers because they may see them in church, standing in line at the bank, or picking up their children from school. Conversely, driving in Orlando or Miami, or New York City can be a far worse driving experience.
”Will the new infrastructure bill make driving safer, and if so, how?
“Yes. Modern beltway design with perfectly paved road surfaces and express lane options will make daily commuter and incoming visitor navigation extremely safe. Moreover, the infrastructure bill includes modern signage design that will inform drivers more visually.
Charlotte, North Carolina, is perhaps one of the best case studies in the nation regarding how the new infrastructure bill will remodel safer highway and beltway roads nationwide.”
Baron Hanson is a consultant with RedBaronConsulting.com
He has worked on several safe driving campaigns.
“Drivers who feel they need to up their driving game need to get back to the basics and get re-trained on the regulations and techniques used on the roads. New drivers are often the most cautious, but this practice dims until it becomes quite rare to observe pure caution on roadways.
Getting a new license after new lessons can refresh our minds and ensure that drivers are up to date on new regulations, road signs, and other relevant changes. Advanced driving courses give drivers additional skills that help to keep pedestrians and property safe.
The WHO provides guidelines on how communities can keep children safe on the roads. These guidelines include speed control, safety equipment for cyclists and other drivers, drinking and driving reduction, restraining children in vehicles, and enhanced road infrastructure.
Federal and local authorities should avoid policies in favor of car manufacturers and road contractors rather than drivers and other road users.
Forcing manufacturers to install safety features such as child seats, air bags, high-end safety belts, and shatterproof windscreens can save numerous lives lost to accidents.
One of the most shocking encounters I had on the road was observing a drunk driver overtake at a bend with his young family in the car. Needless to say, I was quite shaken as I was also going home to my young family and imagining someone endangering them so recklessly sent my heart to my stomach.
Had he been going slower, I would have taken down his license plate and reported him to the relevant authorities.
Some regions have the worst drivers due to factors such as lax traffic laws and a lack of traffic monitoring. Remote areas often do not have traffic monitoring. This encourages drivers to kick it into high gear and race recklessly on the roads.”
Philip Westfall is the Director of Marketing at RVezy.com.
He is a tech enthusiast specializing in RV rentals.
All States Ranked by Driving Ability
Haven’t seen your state yet? That’s good news. If you’re curious, check out where your state stands in the ranking on the map below.
Free Car Insurance Comparison
Enter your ZIP code below to view companies that have cheap car insurance rates.
![]() Secured with SHA-256 Encryption
Secured with SHA-256 Encryption
Frequently Asked Questions: All About the Worst Drivers
Now that we’ve covered the states with the worst drivers and how we can improve safe driving habits, let’s look at some frequently asked questions on this subject. These include common questions that people have about driving behavior and state standings. Let’s jump in.
#1 – What state has the worst drivers?
Overall, the state with the worst drivers is Montana. The state of Montana has a high car accident death rate as well as high rates of speeding, drunk driving, drivers failing to obey, and careless driving.
#2 – What are the qualities of a bad driver?
Someone is considered a bad driver when they practice driving habits that endanger other people on the road. Dangerous driving habits that bad drivers may have been speeding, drunk driving, careless driving, failing to obey traffic signals or officers, seatbelt use, and driving with an invalid driver’s license.
#3 – Which state has the safest drivers?
The state with the safest drivers is New Jersey. New Jersey has a low rate of careless driving across the state. It also has low rates of drunk driving and fatality rate compared to all other states in the U.S.
Read More: Which state has the best drivers?
#4 – What state has the fastest drivers?
Rhode Island is the state that suffers from the most deadly speeding accidents. Out of the total car accident fatalities in the state, 63% of those involved speeding. That is the highest rate of fatal speeding crashes than any other state.
Methodology: Determining the States With the Worst Drivers
To determine the 10 states with the worst drivers and the overall ranking, our researchers found data on the following five categories: death rate per 100 million miles driven in the state, failure to obey, careless driving, drunk driving, and speeding.
Our analysts created subcategories within three of the categories to determine the numbered rankings: failure to obey (involving traffic safety devices, safety restraint not used, involving an invalidly licensed driver), careless driving (pedestrian death rate, cyclist death rate), and drunk driving (BAC at .08 or above, BAC between .01 and .07).
Our experts assigned each state a numbered value in each subcategory. The numbered values were then summed to determine that state’s category ranking. Then, each category score was added together to determine the state’s “summed category score.”The lower its summed category score compared to other states, the worse the state fared in the overall ranking.
We used various data sources from the National Highway Traffic Safety Association (NHTSA), including CrashStats and Fatality Analysis Reporting System (FARS).
Previous Results of this Study
- Worst Drivers Study 2021
- Worst Drivers Study 2019
- Worst Drivers Study 2018
- Worst Drivers Study 2017
- Worst Drivers Study 2016
- Worst Drivers Study 2015
- Worst Drivers Study 2014
Frequently Asked Questions
What are the common unsafe driving behaviors found in states with the worst drivers?
States with the worst drivers tend to have high rates of fatal car accidents involving speeding, drunk driving, careless driving, and breaking traffic laws.
Are there any states from the Northeast region included in the top 10 worst states?
No, there are no states from the Northeast region of the U.S. included in the top 10 worst states
How do driver education and advanced vehicle technology help in lowering the risk in states with the worst drivers?
Driver education programs can help improve driving skills and promote safe driving habits among drivers. Advanced vehicle technology, such as collision avoidance systems, can assist drivers in avoiding accidents and reducing the impact of collisions.
Does having a bad driving record affect car insurance rates?
Yes, having a bad driving record, including accidents and other violations, can significantly impact car insurance rates. Insurance companies consider a driver’s history of accidents and violations as indicators of risk, leading to higher premiums for those with a poor driving record.
What can drivers do to improve their driving skills and reduce the risk of accidents?
Drivers can consider taking a driving course to brush up on safe driving habits. These courses can provide valuable knowledge and techniques to help drivers become more skilled and aware on the road.
Free Car Insurance Comparison
Enter your ZIP code below to view companies that have cheap car insurance rates.
![]() Secured with SHA-256 Encryption
Secured with SHA-256 Encryption
Brandon Frady
Licensed Insurance Agent
Brandon Frady has been a licensed insurance agent and insurance office manager since 2018. He has experience in ventures from retail to finance, working positions from cashier to management, but it wasn’t until Brandon started working in the insurance industry that he truly felt at home in his career. In his day-to-day interactions, he aims to live out his business philosophy in how he treats hi...
Licensed Insurance Agent
Editorial Guidelines: We are a free online resource for anyone interested in learning more about auto insurance. Our goal is to be an objective, third-party resource for everything auto insurance related. We update our site regularly, and all content is reviewed by auto insurance experts.


