Cheapest Indiana Car Insurance Rates in 2025 (Save With These 10 Companies)
The cheapest Indiana car insurance rates are offered by USAA, State Farm, and Progressive, with rates as low as $15 monthly. These companies are the best due to their comprehensive coverage options, and customer satisfaction. Find out how to secure the most cost-effective insurance in Indiana.
Free Car Insurance Comparison
Compare Quotes From Top Companies and Save
Secured with SHA-256 Encryption

Brad Larson
Licensed Insurance Agent
Brad Larson has been in the insurance industry for over 16 years. He specializes in helping clients navigate the claims process, with a particular emphasis on coverage analysis. He received his bachelor’s degree from the University of Utah in Political Science. He also holds an Associate in Claims (AIC) and Associate in General Insurance (AINS) designations, as well as a Utah Property and Casual...
Licensed Insurance Agent
UPDATED: Feb 26, 2025
It’s all about you. We want to help you make the right coverage choices.
Advertiser Disclosure: We strive to help you make confident car insurance decisions. Comparison shopping should be easy. We are not affiliated with any one car insurance company and cannot guarantee quotes from any single company.
Our partnerships don’t influence our content. Our opinions are our own. To compare quotes from top car companies please enter your ZIP code above to use the free quote tool. The more quotes you compare, the more chances to save.
Editorial Guidelines: We are a free online resource for anyone interested in learning more about auto insurance. Our goal is to be an objective, third-party resource for everything auto insurance related. We update our site regularly, and all content is reviewed by auto insurance experts.
UPDATED: Feb 26, 2025
It’s all about you. We want to help you make the right coverage choices.
Advertiser Disclosure: We strive to help you make confident car insurance decisions. Comparison shopping should be easy. We are not affiliated with any one car insurance company and cannot guarantee quotes from any single company.
Our partnerships don’t influence our content. Our opinions are our own. To compare quotes from top car companies please enter your ZIP code above to use the free quote tool. The more quotes you compare, the more chances to save.
On This Page
 6,589 reviews
Company Facts
Min. Coverage in Indiana
A.M. Best Rating
Complaint Level
Pros & Cons
 6,589 reviews
 18,155 reviews
Company Facts
Min. Coverage in Indiana
A.M. Best Rating
Complaint Level
Pros & Cons
 18,155 reviews
 13,283 reviews
Company Facts
Min. Coverage in Indiana
A.M. Best Rating
Complaint Level
Pros & Cons
 13,283 reviews
When seeking the cheapest Indiana car insurance rates, look no further than USAA, State Farm, and Progressive, offering premiums as low as $15 per month. USAA stands out for its exceptional customer service and comprehensive coverage options, making it the top pick overall for Indiana drivers seeking reliable and affordable insurance protection.

Choosing the right Indiana car insurance provider is crucial with the state’s high rate of uninsured drivers getting behind the wheel without coverage. Whether you’re a resident or moving here, explore our guide to rates, coverages, and state laws for informed choices.
Our Top 10 Company Picks: Cheapest Indiana Car Insurance Rates
Company Rank Monthly Rates A.M. Best Best For Jump to Pros/Cons
#1 $15 A++ Military Members USAA
#2 $24 B Local Agents State Farm
#3 $25 A+ Competitive Rates Progressive
#4 $26 A++ Bundling Policies Travelers
#5 $27 A Safe-Driving Discounts Farmers
#6 $37 A Loyalty Rewards American Family
#7 $43 A+ Tailored Policies The Hartford
#8 $48 A+ Infrequent Drivers Allstate
#9 $54 A High-Risk Coverage The General
#10 $63 A Add-on Coverages Liberty Mutual
Take the first step toward cheaper car insurance rates. Enter your ZIP code above to see how much you could save.
- Indiana car insurance rates as low as $15 per month with USAA
- Protection against uninsured drivers prevalent in Indiana
- Explore comprehensive coverage options and state driving laws
- Compare Indiana Car Insurance Rates
- Best Seymour, IN Car Insurance in 2025
- Best Schererville, IN Car Insurance in 2025
- Best Pekin, IN Car Insurance in 2025
- Best New Castle, IN Car Insurance in 2025
- Best Kendallville, IN Car Insurance in 2025
- Best Hobart, IN Car Insurance in 2025
- Best Greenwood, IN Car Insurance in 2025
- Best Carmel, IN Car Insurance in 2025
- Best Indianapolis, IN Car Insurance in 2025
Free Car Insurance Comparison
Enter your ZIP code below to view companies that have cheap car insurance rates.
Secured with SHA-256 Encryption
Indiana Car Insurance Coverage and Rates
Indiana offers a wealth of attractions for residents and visitors alike, from the scenic Indiana Dunes National Park on Lake Michigan to the hiker’s paradise of Brown County State Park. One unique town, Santa Claus, receives thousands of “Dear Santa” letters each year.
Known as the Hoosier State, Indiana produces about 90% of the world’s popcorn. Additionally, Parke County, with its 32 covered bridges, is nicknamed the Covered Bridge Capital of the World.
Compare Car Insurance Rates in Indiana
Indiana Car Insurance Cost by City
This comprehensive analysis allows you to make informed decisions about your car insurance coverage based on the rates in Carmel, New Castle, Greenwood, Pekin, Hobart, Schererville, Indianapolis, Seymour, and Kendallville.
Auto Insurance in Indiana
The bodily injury and property damage liability coverage limits are the minimums required under Indiana law. It is advisable to consider higher coverage limits to protect your assets.
In the event you cause a severe collision and your coverages are insufficient to pay for the injured party’s total damages, your personal assets would be on the line once your policy limits were exhausted.
The liability car insurance coverage mentioned cover the cost of things like medical expenses, property damage, and other bills incurred by any drivers, pedestrians, or passengers who are injured or incur vehicle damage due to a collision you are responsible for.
Your liability coverages will also apply if a member of your family is behind the wheel of your vehicle or if you have consented to let someone else drive your vehicle.
Indiana Minimum Car Insurance Coverage Requirements
| Insurance Required | Coverages |
|---|---|
| Bodily Injury Liability Coverage | $25,000 per person / $50,000 per accident |
| Uninsured Motorist Coverage | $25,000 per person / $50,000 per accident |
| Property Damage Liability Coverage | $25,000 minimum |
| Underinsured Motorist Coverage | $50,000 minimum |
The table above details the minimum car insurance coverages required under Indiana state law. Let’s take a closer look at what each of these means for you:
- Bodily Injury Liability: $25,000 per person / $50,000 per accident to cover injury or death costs from accidents you cause.
- Property Damage Liability: $25,000 to cover property damage costs from accidents you cause.
- Uninsured/Underinsured Motorist Coverage: Includes $25,000 per person / $50,000 per accident for injuries and $25,000 for property damage in accidents with uninsured or underinsured drivers.
Bear in mind, these liability coverage options do not cover any injuries you incur due to an accident. The state of Indiana also requires drivers to carry uninsured and underinsured motorist coverage on their policy.
Many states leave these coverages as optional add-ons, but you must maintain the minimums mentioned above to comply with current Indiana regulations unless you opt to waive them in writing when buying your policy.
You might be wondering what these levels of coverage would cost you in both Indiana and other states. Take a look at our interactive graphic below.
Like most other states in the country, Indiana adheres to the fault system, which means that whoever causes the accident is responsible to cover damages incurred by other drivers, passengers, and/or pedestrians as a result.
In reality, the driver’s Indiana car insurance company will handle these losses, up to and until policy limits are fully exhausted.
Forms of Financial Responsibility in Indiana
If you get into an accident in the state of Indiana, you will likely be asked to show proof of insurance to the responding law enforcement officer. You can do so by presenting your insurer-issued proof of insurance card.
If you are unable to show the responding officer proof of insurance, your license will be suspended until you can present such to the Indiana Bureau of Motor Vehicles.
However, if you ever get into an accident in the state of Indiana, the Indiana Bureau of Motor Vehicles will mail you a verification request form for proof of financial responsibility if you have been involved in any of the following:
- An auto accident in which the Bureau of Motor Vehicles is sent a copy of the accident report
- A pointable moving violation within a year of being issued two additional pointable moving violations
- A grave traffic violation like a felony or misdemeanor
- If you were issued a pointable violation and had your license suspended previously for failure to offer proof of financial responsibility
If any of these scenarios apply to you, the Indiana BMV will send a verification form to your address, at which point you must have your insurer file an electronic Certificate of Compliance Form as proof of insurance with the BMV. The insurer may submit this proof of insurance through the state’s Electronic Forms Submission or EIFS portal for processing.
The Certificate of Compliance form serves to show the BMV that the car you were driving at the time of the collision was insured according to the state required minimums.
Your personal income is what you have left to pay bills, save, or spend once taxes are taken out.
Brad Larson LICENSED INSURANCE AGENT
The Indiana BMV must receive and process the Certificate of Compliance within 90 days of the initial verification request being sent or you face having your driving privileges suspended.
You may also have your insurer submit the Certificate of Compliance form before you receive the verification request, but the information must be completely accurate or your driving privileges could be suspended and the form will need to be resubmitted.
First-time offenders of Indiana’s proof of financial responsibility laws typically face having their driving privileges suspended. They may also be required by law to file an SR22 insurance in Indiana along with their insurance in order to be allowed behind the wheel again.
Average Monthly Car Insurance Rates in IN (Liability, Collision, Comprehensive)
Let’s take a look at average Indiana car insurance rates per month. Understanding these averages can help you make informed decisions about your coverage options and budget accordingly. Car insurance rates can vary widely based on the type of coverage, so it’s essential to compare different types to find the best fit for your needs.
Indiana Car Insurance Cost by Coverage Type
| Coverage Types | Monthly Rates |
|---|---|
| Liability | $32 |
| Collision | $21 |
| Comprehensive | $10 |
| Full Coverage | $63 |
The table above includes data from the NAIC’s (National Association of Insurance Commissioners) most recent study. This comprehensive data provides valuable insights into the cost of car insurance in Indiana.
Expect rates to go up in Indiana from this point onward, so it’s wise to stay updated on trends and consider shopping around to ensure you’re getting the best possible rate.
Additional Liability Coverage in Indiana
If a company consistently sees a loss ratio above 100%, they are paying out more money in claims than they are earning back in consumer premiums. However, the table here reveals that Indiana car insurance companies are seeing healthy gains to losses.
Indiana Additional Liability Coverage by Loss Ratio
| Loss Ratio | 2023 | 2022 | 2021 |
|---|---|---|---|
| Medical Payments (MedPay) | 85% | 83% | 80% |
| Uninsured/Underinsured Motorist Coverage | 73% | 64% | 60% |
The table above reveals the average loss ratio for Indiana car insurance companies between 2013 and 2015, taken from a recent report by the NAIC. A company’s loss ratio is the percentage of losses they suffer compared to the premiums they are writing for insureds.
The NAIC’s study did not include gains to losses for personal injury protection insurance (PIP). To read the report in further detail, click here.
Remember, Indiana currently ranks 8th in the nation for uninsured drivers, with 16.7% of drivers getting behind the wheel without insurance coverage.
With that in mind, it’s in your best interest to consider taking out insurance coverages beyond the minimum limits. For instance, optional coverages like MedPay are a valuable choice to consider to cover the costs of expenses like personal medical bills if you get into a collision.
If you get into an accident, MedPay will cover these costs up to a set amount, regardless of who caused the accident.
Speaking of which, let’s take a look at some add-ons you can opt to include in your Indiana car insurance policy.
Add-ons, Endorsements, and Riders
Check out these valuable add-ons you’ll definitely want to consider adding to your Indiana car insurance policy. These additional coverages can provide extra protection and peace of mind, ensuring you are well-prepared for unexpected situations on the road:
- Emergency roadside assistance
- Mechanical breakdown insurance
- Personal umbrella policy (PUP)
- Guaranteed auto protection
- Modified car insurance coverage
- Non-owner car insurance
- Rental car reimbursement coverage
- Usage-based car insurance
- Classic car insurance
By incorporating these add-ons, endorsements, and riders into your Indiana car insurance policy, you can enhance your coverage and address specific needs that basic insurance might not cover. These options offer tailored solutions for various scenarios, providing you with comprehensive protection and financial security on the road.
Average Monthly Car Insurance Rates by Age & Gender in IN
Age and gender are two significant factors that insurance carriers often use to assess your monthly premiums. While it is often thought that male drivers are charged the highest rates when compared with female drivers, this is not always the case. Learn more about car insurance rates by age and gender.
Age can be an even more relevant factor than gender in certain instances, but it often boils down the individual insurance carrier.
Let’s take a closer look.
Demographic and Insurance Carrier
Some insurers have a bigger rate gap between male vs. female teen drivers, while others charge teen drivers similar premiums across the board, regardless of gender.
For example, American Family charges 17-year-old male drivers nearly $300 more in monthly premiums than they do 17-year-old female drivers. However, carriers like USAA only have about a $340 rate difference between teen male and female drivers. Learn more about 17-year-old driver car insurance rates.
Indiana Car Insurance Monthly Rates by Age, Gender, & Provider
| Insurance Company | Age: 17 Male | Age: 17 Female | Age: 25 Male | Age: 25 Female | Age: 35 Male | Age: 35 Female | Age: 60 Male | Age: 60 Female |
|---|---|---|---|---|---|---|---|---|
| Allstate | $105 | $97 | $53 | $49 | $46 | $43 | $37 | $37 |
| American Family | $92 | $81 | $47 | $38 | $34 | $34 | $27 | $27 |
| Farmers | $85 | $78 | $43 | $39 | $26 | $23 | $19 | $19 |
| Geico | $49 | $54 | $24 | $27 | $20 | $20 | $16 | $16 |
| Liberty Mutual | $185 | $156 | $91 | $65 | $57 | $57 | $45 | $45 |
| Nationwide | $89 | $81 | $44 | $40 | $31 | $29 | $23 | $23 |
| Progressive | $72 | $68 | $34 | $33 | $23 | $22 | $18 | $18 |
| State Farm | $66 | $60 | $31 | $28 | $22 | $22 | $17 | $17 |
| Travco | $77 | $71 | $38 | $34 | $27 | $26 | $21 | $21 |
| USAA | $49 | $46 | $23 | $22 | $14 | $13 | $11 | $11 |
As you can see from the table above, teen drivers are the demographic who are going to see the biggest rate jump when compared to other driver age groups.
When you step back and compare the rates insureds are charging teen drivers compared to the rest of the driving public, the gap can be pretty wide. For example, Progressive charges single 17-year-old male drivers approximately $940 more in monthly premiums than they do married 35-year-old male drivers.
Besides your age and gender, married vs. single status can also have a huge impact on your monthly rates. Insurance companies often adhere to the train of thought that married insureds are generally more stable, and are therefore going to be more responsible drivers when they get behind the wheel. Read more about married vs. single car insurance.
Best Indiana Car Insurance Companies
Consumer ratings and satisfaction are an essential factor you’ll need to consider when selecting the best Indiana car insurance company to meet your needs. Let’s see how the top carriers really rank with insurers.
Indiana Car Insurance Companies’ Financial Ratings
AM Best is a global agency, releasing ratings for insurance carriers around the world based on their assessed creditworthiness and financial strength. See table below:
A.M. Best Financial Strength Ratings From the Top Indiana Car Insurance Providers
| Insurance Company | A.M. Best |
|---|---|
| Allstate | A+ |
| American Family | A |
| Auto-Owners | A++ |
| Erie | A+ |
| Geico | A++ |
| Indiana Farm Bureau | A- |
| Liberty Mutual | A |
| Progressive | A+ |
| State Farm | B |
| USAA | A++ |
A++ is the superior rating AM awards, while any other A ratings reveal that a carrier has an excellent ability to fulfill financial obligations to consumers.
Indiana Car Insurance Companies With the MOST Customer Complaints
The table below is the most recent Consumer Auto Complaint Index released by the Indiana Department of Insurance. The complaint index is determined by comparing the number of each carrier’s premiums with the number of complaints closed over the course of a calendar year.
Insurance Companies in Indiana with the Most Customer Complaints
| NAIC # | Insurance Company | Complaint Index | Total Complaints | Premiums |
|---|---|---|---|---|
| 25941 | United Service | 59.98 | 2 | $33,342 |
| 26271 | Erie | 25.54 | 4 | $156,630 |
| 21253 | Garrison | 18.20 | 2 | $10,799 |
| 39217 | QBE | 3.78 | 1 | $264,894 |
| 11198 | Loya | 1.96 | 2 | $1,020,790 |
| 15032 | Guideone | 1.68 | 1 | $595,878 |
| 25054 | Hudson | 1.65 | 1 | $604,842 |
| 39098 | Omni | 1.42 | 3 | $2,107,044 |
| 42404 | Liberty | 1.23 | 1 | $815,224 |
| 33600 | LM | 1.20 | 2 | $1,666,446 |
| 35289 | Continental | 1.00 | 1 | $1,001,305 |
| 10864 | American Freedom | 0.96 | 10 | $10,464,341 |
| 10655 | Unique | 0.96 | 2 | $2,087,202 |
| 44245 | 21st Century | 0.89 | 1 | $1,126,992 |
| 14249 | Founders | 0.73 | 18 | $24,516,935 |
| 14941 | Lighthouse | 0.72 | 2 | $2,775,797 |
| 13056 | RLI | 0.57 | 1 | $1,763,035 |
| 10336 | First Acceptance | 0.41 | 4 | $9,721,986 |
| 37648 | Permanent | 0.36 | 8 | $21,944,533 |
| 10730 | American Access | 0.33 | 6 | $18,370,556 |
| 11185 | Foremost | 0.33 | 1 | $3,035,976 |
| 13986 | Frankenmuth | 0.28 | 1 | $3,510,809 |
| 11004 | Trexis One | 0.24 | 1 | $4,207,389 |
| 13137 | Viking | 0.23 | 1 | $4,368,438 |
| 19240 | Allstate | 0.21 | 2 | $9,380,967 |
| 13688 | Elephant | 0.21 | 1 | $4,742,452 |
| 34690 | The Hartford | 0.21 | 1 | $4,753,235 |
| 28188 | Travco | 0.21 | 3 | $14,005,377 |
| 19658 | Bristol West | 0.20 | 3 | $15,258,233 |
| 26298 | Metropolitan | 0.19 | 2 | $10,736,831 |
| 25405 | Safe Auto | 0.19 | 6 | $31,047,710 |
| 19283 | American Standard | 0.18 | 1 | $5,478,415 |
| 11558 | AssuranceAmerica | 0.18 | 1 | $5,463,895 |
| 22640 | Consolidated | 0.18 | 10 | $55,840,770 |
| 10648 | Geneva | 0.18 | 3 | $1,641,309 |
| 28401 | American National | 0.16 | 1 | $6,334,686 |
| 21326 | Empire | 0.16 | 1 | $6,279,485 |
| 16144 | Grinnell | 0.16 | 1 | $6,124,176 |
| 22667 | Ace America | 0.15 | 1 | $6,818,835 |
| 11150 | Arch | 0.15 | 1 | $6,453,691 |
| 10322 | Grange | 0.15 | 1 | $6,853,804 |
| 19070 | Standard | 0.15 | 7 | $46,312,500 |
| 13587 | First Chicago | 0.13 | 3 | $22,770,536 |
| 42579 | Allied | 0.11 | 1 | $9,348,636 |
| 19275 | American Family | 0.11 | 12 | $105,497,365 |
| 25712 | Esurance | 0.11 | 2 | $17,490,230 |
| 41653 | Milbank | 0.11 | 1 | $9,508,880 |
| 19992 | American Select | 0.10 | 2 | $19,593,305 |
| 37214 | American States | 0.10 | 1 | $10,456,815 |
| 24082 | Ohio Security | 0.10 | 1 | $10,299,628 |
| 11215 | Safeco | 0.09 | 11 | $119,087,321 |
| 15350 | West Bend | 0.08 | 2 | $23,598,227 |
| 14138 | Geico Advantage | 0.07 | 2 | $29,078,992 |
| 19259 | Selective | 0.07 | 1 | $15,184,280 |
| 24112 | Westfield | 0.07 | 1 | $13,384,635 |
| 22292 | Hanover | 0.06 | 1 | $17,744,284 |
| 23787 | Nationwide | 0.06 | 2 | $31,025,294 |
| 37770 | CSAA | 0.05 | 1 | $21,594,213 |
| 27120 | Trumbull | 0.05 | 1 | $19,962,617 |
| 40118 | Trustgard | 0.05 | 1 | $20,860,827 |
| 18988 | Auto-Owners | 0.04 | 5 | $114,691,864 |
| 38784 | Progressive | 0.04 | 8 | $226,241,918 |
| 15288 | United Farm | 0.04 | 11 | $291,607,837 |
| 18600 | USAA | 0.04 | 1 | $28,393,360 |
| 42587 | Depositors | 0.03 | 1 | $30,041,847 |
| 25178 | State Farm | 0.03 | 26 | $847,420,643 |
| 22624 | Indiana Farmers | 0.01 | 1 | $93,833,871 |
Read More: CSAA Car Insurance Review
If a company has a complaint index of 1.00, this reveals that the company’s quantity of complaints received is the same as its total share of premiums written in the year, which is also the average NAIC complaint index score.
If a carrier has a 2.00 index, this shows that the company’s complaints are twice as much as its share of premiums written. Companies with a 0.50 index have received complaints that are proportionately half as much as their total premiums written.
Bear in mind, consumer complaints are based on overall satisfaction, and are just one piece of the puzzle to consider when picking an Indiana car insurance carrier. Visit the Indiana Department of Insurance’s website for additional information.
Indiana Car Insurance Rates by Provider
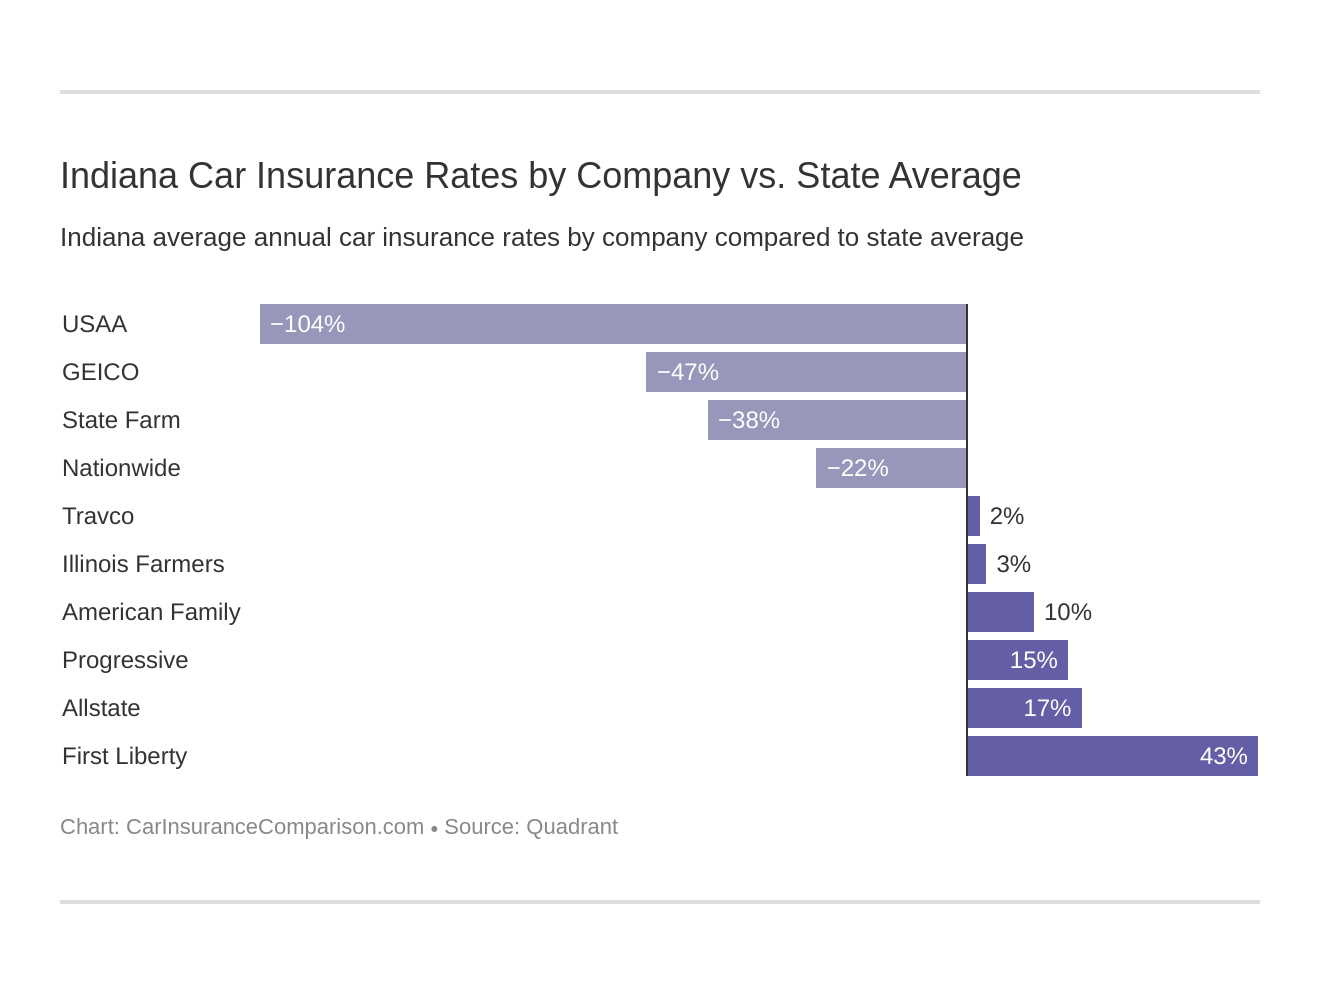
Rates are probably going to be the primary factor you take into account when choosing an Indiana car insurance provider.
Take a look at the chart above, which shows the top carriers in the Hoosier State and their average monthly rates juxtaposed against the overarching state average. Below we can see a few examples of factors that affect your rates.
As you can see, USAA charges the lowest monthly premiums and First Liberty the highest, with more than a $400 gap between the two.
Credit History Rates
Except for a handful of states that strictly ban the practice, insurance carriers in Indiana can and do use your credit score as a factor when assessing your monthly premiums. For example, American Family charges consumers with poor credit nearly $230 more in monthly premiums than insureds with good credit.
Indiana Full Coverage Car Insurance Monthly Rates by Credit Score & Provider
| Insurance Company | Bad Credit | Fair Credit | Good Credit |
|---|---|---|---|
| Allstate | $225 | $180 | $150 |
| American Family | $156 | $125 | $100 |
| Farmers | $157 | $128 | $115 |
| Geico | $105 | $90 | $75 |
| Liberty Mutual | $170 | $140 | $120 |
| Metromile | $130 | $110 | $95 |
| Nationwide | $151 | $126 | $109 |
| Progressive | $157 | $129 | $110 |
| State Farm | $160 | $130 | $115 |
| Travelers | $147 | $123 | $109 |
| USAA | $116 | $90 | $65 |
| U.S. Average | $115 | $140 | $210 |
A study by Experian revealed that Indiana is one of the top 10 states with the lowest credit card debt in the country, with the average state resident having a card balance of $5,581. Also, the standard Indiana resident has a VantageScore of 667 with approximately 2.77 cards to their name.
Not bad, considering the average nationwide credit score is 675.While your credit score is just one of many factors Indiana car insurance companies may use to assess your rates, having a poor vs. good credit score can really make a difference in your monthly premiums. In some cases, you could be charged thousands of dollars more per year for having a poor credit score.
By practicing good credit habits, paying your bill on time, and not spending beyond what you can afford to pay each month, you’ll not only have an easier time finding an apartment to rent or securing a mortgage but could see very reasonable car insurance rates come your way too.
Driving Record Rates
Take a close look at the table below. Some carriers have a pretty wide gap in rates for clean records vs. those with one DUI, while others don’t increase their rates too significantly. Liberty Mutual, for example, charges insureds with one DUI on their record nearly $4,000 more in monthly premiums than consumers with a clean record.
Indiana Full Coverage Car Insurance Monthly Rates by Driving Record & Provider
| Insurance Company | Clean Record | One Accident | One Ticket | One DUI |
|---|---|---|---|---|
| Allstate | $194 | $232 | $194 | $194 |
| American Family | $81 | $142 | $142 | $186 |
| Farmers | $113 | $163 | $163 | $195 |
| Geico | $82 | $82 | $135 | $159 |
| Liberty Mutual | $192 | $192 | $192 | $192 |
| Nationwide | $109 | $140 | $140 | $143 |
| Progressive | $129 | $150 | $150 | $92 |
| State Farm | $129 | $144 | $144 | $144 |
| Travelers | $111 | $123 | $123 | $122 |
| USAA | $65 | $65 | $65 | $65 |
| U.S. Average | $119 | $173 | $147 | $209 |
Not surprisingly, your driving record is another key element insurance companies will review when assessing your monthly rates. Having a clean driving record or one with minimal violations is a good sign to insurance companies that you practice safe habits on the road and pose little risk to insure. Find out if all car insurance companies check your driving records.
On the other hand, records with a DUI or speeding violation often present a red flag to carriers that the individual may pose more risk to insure, which often translates to higher rates.
A company like Nationwide, on the other hand, only has a $500 or so rate difference for a record with one DUI vs. no driving violations.
The moral of the story is, some carriers are more forgiving than others when it comes to speeding violations. In general though, sticking to responsible driving habits while on the road won’t just keep your rates down, but will keep you safe while behind the wheel too.
Number of Car Insurance Providers in Indiana
The number of car insurance providers available in a state reflects the diversity and competitiveness of its insurance market. The following table presents the total number of property and casualty insurance providers in Indiana, categorized by domestic and foreign companies.
Number of Indiana Car Insurance Companies
| Summary | Totals |
|---|---|
| Domestic | 64 |
| Foreign | 958 |
| Total | 1,022 |
This extensive range of options ensures that consumers have access to a wide variety of policies and coverage options, promoting a competitive environment that can lead to better rates and services for policyholders.
Driving Laws in Indiana
Now that you’re well-versed in the key factors Indiana car insurance providers can and will use to assess your monthly premiums, it’s time to dive into the driving laws all motorists in the state need to be aware of.
Without further ado, let’s get down to business.
Indiana’s Car Insurance Laws
As with any state, the car insurance laws in Indiana are changed and updated to ensure greater safety for drivers of every age. It’s important to stay up to date with Indiana car insurance laws to ensure you know what your rights are and your obligations under current regulations.
The state of Indiana has completely banned all drivers from texting while driving, while newbie drivers are forbidden from using a mobile device at all while behind the wheel (either hands-free or hand-held). If unable to provide proof of financial responsibility or proof of insurance, drivers face a 90-day to a one-year suspension of their driving privileges.
Let’s take a closer look at car insurance laws in the state of Indiana.
High-Risk Insurance
Drivers in the Hoosier State with a history of traffic violations, accidents, and/or DUIs may find it very difficult to secure auto insurance through standard channels. If you have a poor driving record and have found it difficult or impossible to secure auto insurance coverage, you might be eligible for Indiana’s high-risk auto insurance plan.
While you should only seek out high-risk insurance if you have exhausted all other channels, the Indiana Automobile Insurance Plan (IN AIP) is a potentially viable coverage option if you are unable to find coverage elsewhere.
Staying informed will help protect your family during an emergency. As we approach #hurricaneseason, we hosted a “Huddle Up for Hurricane Prep” in Houston with Defensive End, @will_anderson28. Thanks to U.S. Coast Guard Sector Houston-Galveston for the tour and education on storm… pic.twitter.com/J1gcRvuHuk
— USAA (@USAA) June 17, 2024
The program was first created back in 1948 and stands as an agreement between licensed carriers to take on a certain percentage of the high-risk motorists in the state in congruence with their share of their insurance market in Indiana.
The idea behind IN AIP is to ensure that motorists in the state who fulfill the eligibility requirements can obtain coverage, particularly if they have not been able to secure insurance the standard route. The program’s approach of distributing high-risk drivers to carriers based on the company’s share of the insurance market in the state ensures that no single insurer bears too heavy of losses.
You will not be able to select your own insurance carrier through IN AIP, rather one will be assigned to you through the program. To be considered eligible for the program, you must:
- Certify that you have applied for insurance with three Indiana carriers in the past 60 days and were rejected
- You must name each of the carriers you applied to
- Have a valid driver’s license
- Have a registered vehicle in the state of Indiana (or one to be registered within a period of 15 days)
If you put misinformation on your application or have outstanding premiums owed to a previous carrier, you may not be eligible for coverage through IN AIP. If the issue is an unpaid premium, you may resubmit your application to IN AIP once the bill is paid in full.
However, if you put false information on your application you will be barred from applying for an additional year. Most of the time, your premiums will be higher through IN AIP than they would be if you obtained insurance the standard route.
That said, IN AIP takes multiple factors into account when assessing your monthly car insurance premiums. You will have two ways to pay your premiums. The first option is to pay 40% of your premium up front when applying and to put the remainder down within a period of 30 days.
Your high-risk insurer will retain what is known as a short rated earned premium (just a little higher than the prorated number) and reimburse you for the remainder.
Your other option is to pay in installments. You would still need to pay 40% of your total yearly premium upfront. However, you won’t be billed for the next 30% until 90 days have passed, and the final 30% will be billed after six month’s time. If you opt for the installment plan, a service fee does apply.
The good news is, if you are able to secure auto insurance coverage at a more affordable price after being accepted into IN AIP, you may cancel your high-risk plan whenever you wish. Just know that if you cancel while the policy is in effect, you will not receive a prorated reimbursement.
Low-Cost Insurance
A few states run low-cost auto insurance programs to cover drivers who meet certain eligibility requirements and income thresholds. At this time, Indiana does not offer any such program.
Windshield Coverage
Some states mandate a waived deductible if you need to have your windshield repaired, while other states only let you use manufacturer replacement parts if a repair is needed.
Indiana car insurance laws don’t currently including anything specific to windshields. If your car is under five years old, you can opt for used, aftermarket, or OEM (original equipment manufacturer) parts as you prefer.
Automobile Insurance Fraud in Indiana
Insurance fraud is a felony in the state of Indiana, typically occurring if an individual attempts to receive a monetary benefit from an insurance company by lying or falsifying what actually took place. Insurance companies can also be found guilty of committing fraud, but for the sake of this guide, we’ll be focusing on consumer auto insurance fraud.
Indiana’s fraud laws are laid out in Indiana Code Title 27, Indiana Code Section 35-43-5-4.5, and Indiana Administrative Code Title 760. Examples of insurance fraud include:
- Filing an insurance claim or offering an oral or written statement that is false or misleading with the intention of defrauding the insurer
- Taking carrier records or assets from the company or hiding them from the Department of Insurance
- Making a false statement or hiding pertinent facts about an insurance claim or benefit to be paid out from the policy
- Causing damage to property in order to receive an insurance benefit
Penalties for committing insurance fraud include imprisonment, fines, and the requirement to make restitution to the victim. Civil penalties may also apply, such as fines and revocation of your policy. The instances of fraud noted above typically fall under the Level Six felony category. The penalties for a Level Six felony include the following:
- Six months to 2.5 years imprisonment
- Fines up to $10,000
If you have previously been convicted of insurance fraud and are convicted again, or if the property value, benefit, or loss is a minimum of $2,500, the felony is categorized as a Level Five offense. The penalties for Level Five felonies include:
- One to six year’s imprisonment
- Fines up to $10,000
If you falsify information on an insurance application, the offense is categorized as a Class A misdemeanor. The penalties for such include:
- One year’s imprisonment
- Fines up to $5,000
In short, auto insurance fraud is a serious crime that carries equally serious penalties. The good news is if you don’t commit insurance fraud you’ve got nothing to worry about.
Statute of Limitations
A statute of limitations is the length of time you have to file a suit with the civil courts following an accident. In the state of Indiana, the statute of limitations for car accident injury matters or property damage claims is two years from the date of the collision.
There are a few caveats to the two-year statute of limitations deadline. For example, if a minor was injured in the wreck, they can’t file a suit until they are of age, so the statute of limitations commences once they turn 18. In addition, if the accident relates to a claim against a county or city, your statute of limitations is just 180 days.
Claims involve a state government agency have a 270-day statute of limitations. A case’s statute of limitations is not to be confused with the length of time you have to file a claim with your insurance company following a wreck. Most carriers require you to file your claim within days, or at most, a few weeks after a collision.
Indiana’s Modified Comparative Negligence Rule
If you ever get into an auto accident in Indiana, it’s imperative to understand how the state’s modified comparative negligence rule could affect any damages you can recover. Indiana’s modified comparative negligence rule means that you can only file a claim against the other driver if you bear less than 51% of the fault for the collision.
What this means, is that you may still be able to recover damages for injuries incurred from the wreck, even if you are partially responsible for the crash. However, any damages you are awarded will be lowered base on the percentage of blame you possess for the collision.
For instance, if you are 30% at fault for an auto accident in the state of Indiana and are awarded $150,000 in total damages, you will receive $105,000. If you are 50% at fault for a crash, you are only eligible to receive 50% of the compensation awarded.
Indiana’s modified comparative negligence rule also means that if you were more than 50% at fault for the accident, you will not be able to receive any damages. In fact, you may be required to compensate the other party or parties for damages and expenses incurred.
Of course, there will be some accidents where more than two parties involved. If multiple individuals are involved in a collision, each party may be allotted a portion of the blame.
Indiana’s Vehicle Licensing Laws
By now, you’ve probably realized that there’s so much more to finding Indiana car insurance and protecting yourself as a driver than just securing the right rates.
Besides Indiana’s key car insurance laws regulating all motorists, you also need to have a thorough understanding of the state’s vehicle licensing laws to ensure you are in compliance. No need to worry, we’ve got you covered. From teen driver laws to license renewal procedures, you’ll be a pro by the end of this guide.
Penalties for Driving Without Insurance
Driving without insurance in the state of Indiana is no joke. It could land you in serious trouble with penalties ranging from license suspension to hefty fines. If you are ever pulled over by a law enforcement officer and asked to provide proof of insurance, you may present either:
- Your insurer-issued proof of insurance card
- A proof of deposit with the state treasurer, a surety bond, or trust fund according to the Indiana Bureau of Motor Vehicle’s requirements
You need to keep proof of insurance with you at all times and always when you get behind the wheel. Remember if you:
- Were involved auto accident in which the Bureau of Motor Vehicles is sent a copy of the accident report
- Received a pointable moving violation within a year of being issued two additional pointable moving violations
- Were found guilty of a grave traffic violation like a felony or misdemeanor
- Were issued a pointable violation and had your license suspended previously for failure to offer proof of financial responsibility
the Indiana BMV will send a verification form to your address, requiring your insurer to file a Certificate of Compliance electronically within 90 days of the request being issued. If the verification form is not filed and processed within 90 days of it being mailed out, your driving privileges will be revoked and may only be reinstated once the Certificate of Compliance is filed.
Penalties for driving uninsured in the state of Indiana are as follows.
For first-time offenders:
- 90-day license suspension
- You must carry an SR-22 certificate for three years
For second-time offenders:
- $500 fine
- One-year license suspension
- You must carry an SR-22 certificate for three years
Any offenses thereafter or failure to comply with the above will lead to a:
- $1,000 license reinstatement fee
- One-year license suspension
- You must carry an SR-22 certificate for five years
These stringent measures underscore the state’s commitment to ensuring road safety and compliance with driving regulations.
Teen Driver Laws
Here’s what you need to know about teen driver laws in the state of Indiana.
You must be at least 15 to obtain your learner’s license. To obtain a restricted license or license, you are required to:
- Have your learner’s license for at least six months
- Complete 50 hours of supervised driving time, 10 of which need to be at night
- Be at least 16 years and three months of age
Restrictions during the intermediate licensing stage include:
- No driving between the hours of 10 P.M. and 5 A.M. during the initial six months
- After the first six months, no driving between the hours of 11 P.M. and 5 A.M. Sunday through Friday or 1 A.M. to 5 A.M. Saturday through Sunday
- No passengers except for family members
Nighttime restrictions may be lifted after six months if the teen driver is 18 or after they turn 21, whichever happens first. The passenger restrictions will be lifted after six months or upon turning 21, whichever takes place first.
Furthermore, teens enrolled in driver’s education must be at least 15 to obtain a permit. Without driver’s education, the minimum age is 16. While you must be at least 16-and-three months of age to obtain a provisional license, you must be 16-and-nine months old without driver’s education.
Individuals who receive a license under the age of 21 are required to follow the nighttime and passenger restrictions for a six-month period or until they turn 21. If under 18, the teen driver’s night restrictions extend beyond six months until they turn 18.
Older Driver and General Population License Renewal Procedures
In Indiana, the license renewal process varies based on the age of the driver. Specific requirements are in place to ensure that older drivers maintain adequate vision and undergo regular renewals.
Older drivers who wish to renew their license must:
- Renew once every three years if between the ages of 75 and 84
- Renew once every two years if 85 or older
- If 75 or older, provide proof of adequate vision at each renewal
- Mail or online renewal is not allowed for drivers 75 and up
The license renewal procedures for the general population are as follows:
- Renew once every six years
- Proof of adequate vision is required if renewing in person
- You can renew online every other renewal
The general population benefits from a six-year renewal cycle with the convenience of online renewal available every other cycle, balancing ease of access with necessary safety checks.
New Residents
If you are a brand new resident in Indiana, here’s what you need to provide the Indiana Bureau of Motor Vehicles to obtain your Indiana driver’s license:
- One document as proof of identity
- One document proving your legal status in the U.S.
- One document as proof of your Social Security number
- Two documents as proof of your Indiana residency
– Negligent Operator Treatment System
In the state of Indiana, under Indiana Code Title 9-21-8-52, reckless driving includes:
- Driving at such high or low speeds that you endanger the well-being of individuals or property or impede the flow of traffic
- Passing another car on a curve or slope where your visibility is impaired to under 500 feet
- Passing a school bus that is stopped and has the arm-signal out
Regular reckless driving, such as driving too fast, too slow, or passing another car when it is unsafe to do so are typically considered Class C misdemeanors.
Penalties include 60 days’ imprisonment and up to $500 in fines.
Passing a school bus is a Class B misdemeanor, incurring penalties including up to 180 days’ imprisonment and up to $1,000 in fines. When the reckless driver causes property damage, it is a Class B misdemeanor, punishable by the same penalties, including the potential of license suspension.
When reckless driving causes injury, it is a Class A misdemeanor, punishable by a year’s imprisonment, up to $5,000 in fines, and up to one year’s license suspension. These discounts below can significantly impact rates by offering savings based on factors helping to lower monthly premiums.
These discounts from top insurance providers in Indiana offer valuable opportunities for car owners to save money while maintaining comprehensive coverage and safety on the road.
Indiana’s Rules of the Road
Time to take a closer look at Indiana’s rules of the road. You won’t want to miss these. Let’s get down to business—
Fault vs. No-Fault
Indiana is a fault car accident state, which means that whoever is responsible for the car accident is also held liable to compensate the other party or parties involved for any damages incurred as a result.
The at-fault party’s insurance company will handle such losses until the policy limits are exhausted.
If you are ever at fault for an auto accident, your personal assets could be on the line if your coverages are insufficient to satisfy the costs of the injured party’s damages. You’ll safeguard not only all the drivers in your family but your assets by purchasing coverages above the required state minimums.
Keep Right and Move Over Laws
Indiana’s keep right law requires drivers in the left lanes on highways to move over to the right lane so faster cars can pass. Penalties for violating the keep right rule include traffic citations and potentially up to $500 in fines.
Drivers in the Hoosier state must also drive with caution when approaching an emergency vehicle at a stop in a two or four-lane roadway with flashing lights.
Speed Limits
Check out the speed limits in the state of Indiana:
- 70 mph on rural interstates
- 65 mph on rural interstates for trucks only
- 55 mph on urban interstates
- 60 mph on limited access roads
- 55 mph on all other roads
If possible, you must change lanes or, if you can, lower your speed 10 miles under the posted limit and drive with caution. You must move over or slow down, but you cannot stop in the middle of the roadway.
Seat Belt and Car Seat Laws
All individuals 16 years of age and up must be restrained with a safety belt. Violations incur a minimum $25 fine for first-time offenders.
Children seven years of age and under must be restrained in a child safety seat, while children between the ages of eight and 15 are permitted to wear an adult belt.
Again, a violation will incur a minimum $25 fee for first-time offenders.
In the state of Indiana, if a child weighs over 40 pounds, they may be restrained with a lap belt if the car doesn’t feature lap and shoulder belts or if the lap and shoulder belts (save for ones in the front seat) are already in use to secure children under the age of 16.
Indiana doesn’t currently have any legislation restricting passengers from riding in the cargo seat areas of pickup trucks.
Ridesharing
Rideshare services such as Lyft and Uber take out commercial policies to protect drivers and passengers in the event of a crash. Uber drivers are covered by one million dollar liability policies, including an additional one million for comprehensive, contingent collision, and uninsured/underinsured coverage.
Lyft drivers are also covered by a similar plan, including commercial liability coverage, contingent collision, contingent liability, comprehensive coverage, and uninsured/underinsured motorist coverage.
Rideshare drivers rarely carry their own commercial car insurance policies.
Automation on the Road
Currently, Indiana has approved the use of what is known as “regulated platooning technology.” This allows groups of buses or trucks to travel with set intervals between each at electronically controlled rates of speed.
Indiana’s Safety Laws
We know you want to feel and stay safe when you and your loved ones get behind the wheel. Here’s what you need to know about safety laws in the state of Indiana.
DUI Laws
Indiana’s DUI laws are designed to deter impaired driving and ensure road safety by imposing strict penalties on offenders. The following table provides detailed information on the legal limits, criminal classifications, and penalties associated with DUI offenses in Indiana.
Indiana's DUI Laws
| Aspect | Details |
|---|---|
| BAC Limit | 0.08 |
| High BAC Limit | 0.15 |
| Look Back Period/Washout Period | 5 years |
| Criminal Status by Offense | 1st offense: Class C misdemeanor; 1st High BAC: Class A misdemeanor; Subsequent (within 5 years): Class D felonies |
| 1st Offense | ALS/Revocation: 30 days - 2 years or probation with rehab; Imprisonment: Up to 1 year; Fine: $500 to $5,000; Other: May include victim impact panel, urine testing, other probation terms |
| 2nd Offense | DL Revocation: 180 days - 2 years; Imprisonment: 5 days - 3 years and/or community service; Fine: Up to $10,000; Other: Same as 1st offense |
| 3rd Offense | DL Revocation: 1-10 years; Imprisonment: 10 days - 3 years and/or community service; Fine: Up to $10,000; Other: Same as 1st offense |
| Mandatory Interlock | No |
The state imposes significant fines, potential imprisonment, and license revocation, emphasizing the importance of compliance to ensure public safety. These laws reflect Indiana’s commitment to reducing impaired driving incidents and protecting its residents.
Read More: What are the DUI insurance laws in Indiana?
Marijuana-Impaired Driving Laws
In the state of Indiana, the possession and use of marijuana are illegal. Therefore, the state adheres to a zero-tolerance policy for THC and metabolites. In fact, individuals convicted of driving under the influence of a drug face penalties of:
- 60 days to one year’s imprisonment and up to $5,000 in fines for the first offense
- Five days to three year’s imprisonment and up to $10,000 in fines for a second offense
- 10 days to three year’s imprisonment and up to $10,000 in fines for a third offense
Needless to say, it is never advisable to drive in Indiana while under the influence of marijuana or be in possession of the drug, period.
Distracted Driving Laws
Individuals under the age of 21 are forbidden from using a cell phone while driving, and texting is banned for all drivers.
Free Car Insurance Comparison
Enter your ZIP code below to view companies that have cheap car insurance rates.
Secured with SHA-256 Encryption
Fascinating Facts all Indiana Drivers Need to Know
Now that you’re well-acquainted with Indiana’s car insurance laws, vehicle licensing laws, and driving laws, here are the fascinating facts that ALL drivers in the state need to know.
Vehicle Theft in Indiana
In 2013, there were 386 motor vehicle thefts in Fort Wayne alone.
The table below reveals the top 10 stolen vehicles in the state of Indiana.
Top 10 Indiana Car Thefts by Model in 2024
| Make & Model | Year | Total Thefts |
|---|---|---|
| Hyundai Elantra | 2019 | 655 |
| Ford F-150 Series Pickup | 2018 | 652 |
| Chevrolet Silverado 1500 | 2021 | 640 |
| Honda Accord | 1997 | 585 |
| Kia Optima | 2015 | 550 |
| Hyundai Sonata | 2017 | 533 |
| Kia Soul | 2015 | 530 |
| Honda Civic | 2001 | 510 |
| GMC Sierra 1500 | 2018 | 480 |
| Toyota Corolla | 2018 | 475 |
Check out the FBI’s Crime in the U.S. Report for Indiana to see where your city ranks.
Read More: Compare Pontiac Car Insurance Rates
Risky/Harmful Driving Behavior
To help you stay safe when you’re out on the open road, our researchers gathered the following data detailing the common risky/harmful driving behaviors all Indiana drivers need to be aware of.
Let’s take a closer look.
Traffic Fatalities by Weather Condition and Light Condition
The following table presents data on traffic fatalities in Indiana categorized by different weather and light conditions, highlighting the various environmental factors that contribute to fatal accidents.
Fatal Crash in Indiana by Weather Condition & Light Condition
| Weather Condition | Daylight | Dark, but Lit | Dark | Dawn or Dusk | Other / Unknown | Total |
|---|---|---|---|---|---|---|
| Normal | 412 | 110 | 203 | 26 | 1 | 752 |
| Rain | 23 | 8 | 23 | 3 | 0 | 57 |
| Snow/Sleet | 10 | 1 | 5 | 0 | 0 | 16 |
| Other | 5 | 0 | 6 | 0 | 0 | 11 |
| Unknown | 0 | 0 | 0 | 0 | 0 | 0 |
| Total | 450 | 119 | 237 | 29 | 1 | 836 |
By recognizing these patterns, policymakers and drivers can take preventative measures to enhance road safety during adverse weather and low visibility conditions.
Fatalities by County
Traffic fatality data broken down by county provides a localized perspective on road safety in Indiana. The following table lists the number of traffic fatalities in each county, offering insights into regions with higher incidences of fatal accidents.
Indiana Car Crash Fatalities by County
| County Name | Total Fatalities (2021) | Total Fatalities (2022) | Total Fatalities (2023) |
|---|---|---|---|
| Adams County | 7 | 8 | 7 |
| Allen County | 27 | 28 | 30 |
| Bartholomew County | 9 | 10 | 11 |
| Benton County | 3 | 4 | 2 |
| Blackford County | 1 | 1 | 3 |
| Boone County | 7 | 9 | 8 |
| Brown County | 5 | 6 | 5 |
| Carroll County | 3 | 2 | 4 |
| Cass County | 6 | 7 | 6 |
| Clark County | 17 | 15 | 18 |
| Clay County | 4 | 5 | 4 |
| Clinton County | 6 | 7 | 5 |
| Crawford County | 2 | 3 | 3 |
| Daviess County | 4 | 5 | 6 |
| De Kalb County | 5 | 7 | 6 |
| Dearborn County | 6 | 8 | 7 |
| Decatur County | 4 | 4 | 5 |
| Delaware County | 9 | 11 | 10 |
| Dubois County | 5 | 6 | 5 |
| Elkhart County | 16 | 17 | 18 |
| Fayette County | 4 | 5 | 4 |
| Floyd County | 7 | 9 | 8 |
| Fountain County | 3 | 3 | 2 |
| Franklin County | 5 | 6 | 5 |
| Fulton County | 3 | 4 | 3 |
| Gibson County | 4 | 5 | 5 |
| Grant County | 8 | 9 | 10 |
| Greene County | 4 | 5 | 5 |
| Hamilton County | 16 | 18 | 19 |
| Hancock County | 7 | 8 | 8 |
| Harrison County | 5 | 6 | 5 |
| Hendricks County | 12 | 13 | 12 |
| Henry County | 5 | 6 | 5 |
| Howard County | 8 | 10 | 9 |
| Huntington County | 4 | 5 | 5 |
| Jackson County | 6 | 7 | 7 |
| Jasper County | 5 | 6 | 5 |
| Jay County | 3 | 4 | 3 |
| Jefferson County | 4 | 5 | 4 |
| Jennings County | 4 | 4 | 5 |
| Johnson County | 11 | 13 | 12 |
| Knox County | 5 | 6 | 6 |
| Kosciusko County | 9 | 10 | 9 |
| La Porte County | 12 | 13 | 14 |
| Lagrange County | 4 | 5 | 4 |
| Lake County | 31 | 33 | 34 |
| Lawrence County | 6 | 7 | 6 |
| Madison County | 14 | 16 | 15 |
| Marion County | 101 | 110 | 115 |
| Marshall County | 6 | 7 | 6 |
| Martin County | 2 | 3 | 3 |
| Miami County | 4 | 5 | 5 |
| Monroe County | 9 | 10 | 10 |
| Montgomery County | 5 | 6 | 5 |
| Morgan County | 7 | 8 | 8 |
| Newton County | 3 | 3 | 2 |
| Noble County | 6 | 7 | 6 |
| Ohio County | 1 | 1 | 2 |
| Orange County | 3 | 4 | 4 |
| Owen County | 4 | 5 | 4 |
| Parke County | 3 | 3 | 3 |
| Perry County | 3 | 4 | 3 |
| Pike County | 2 | 3 | 2 |
| Porter County | 11 | 13 | 12 |
| Posey County | 3 | 4 | 3 |
| Pulaski County | 2 | 3 | 2 |
| Putnam County | 5 | 6 | 5 |
| Randolph County | 4 | 5 | 4 |
| Ripley County | 4 | 5 | 4 |
| Rush County | 3 | 4 | 3 |
| Scott County | 4 | 5 | 4 |
| Shelby County | 6 | 7 | 7 |
| Spencer County | 3 | 4 | 3 |
| St. Joseph County | 18 | 20 | 21 |
| Starke County | 4 | 5 | 4 |
| Steuben County | 5 | 6 | 5 |
| Sullivan County | 4 | 5 | 4 |
| Switzerland County | 2 | 3 | 2 |
| Tippecanoe County | 13 | 15 | 14 |
| Tipton County | 3 | 3 | 3 |
| Union County | 1 | 2 | 2 |
| Vanderburgh County | 17 | 19 | 18 |
| Vermillion County | 3 | 3 | 3 |
| Vigo County | 12 | 13 | 14 |
| Wabash County | 4 | 5 | 4 |
| Warren County | 2 | 2 | 2 |
| Warrick County | 6 | 7 | 7 |
| Washington County | 5 | 6 | 5 |
| Wayne County | 9 | 10 | 9 |
| Wells County | 3 | 4 | 3 |
| White County | 4 | 5 | 4 |
| Whitley County | 4 | 5 | 4 |
Efforts can be focused on high-risk counties to reduce traffic-related deaths and enhance overall public safety.
Traffic Fatalities
The following table provides a detailed overview of these fatalities, presenting comprehensive data.
Indiana Traffic Fatalities by Area Type in 2024
| Type | Total |
|---|---|
| Rural | 474 |
| Urban | 520 |
By examining yearly trends, stakeholders can better understand the effectiveness of current measures and identify areas needing further attention.
Fatalities by Person Type
This breakdown helps in understanding which groups are most affected by fatal accidents.
Indiana Traffic Fatalities by Person Type in 2024
| Type | Total |
|---|---|
| Occupants (Enclosed Vehicles) | 512 |
| Motorcyclists | 142 |
| Non-Occupants | 136 |
Efforts can be tailored to protect the most vulnerable road users, such as pedestrians and cyclists, reducing overall fatalities and improving road safety for all.
Fatalities by Crash Type
The table below presents traffic fatalities in Indiana categorized by different crash types. This information is crucial for understanding the specific scenarios that lead to fatal accidents and developing targeted prevention strategies.
Indiana Traffic Fatalities by Crash Type in 2024
| Type | Total |
|---|---|
| Single Vehicle | 312 |
| Involving a Large Truck | 68 |
| Involving Speeding | 236 |
| Involving a Rollover | 93 |
| Involving a Roadway Departure | 154 |
| Involving an Intersection (or Intersection Related) | 174 |
Addressing these specific crash types through improved road design, driver education, and stricter enforcement can significantly reduce traffic fatalities.
Fatalities Involving Speeding by top 10 Counties
Speeding is a major factor in traffic fatalities. The following table presents data on fatalities involving speeding in the top 10 counties in Indiana, shedding light on how this risky behavior affects different regions.
Indiana Speeding Fatalities by County
| County Name | Total Fatalities (2021) | Total Fatalities (2022) | Total Fatalities (2023) |
|---|---|---|---|
| Adams County | 2 | 1 | 2 |
| Allen County | 9 | 10 | 12 |
| Bartholomew County | 3 | 4 | 4 |
| Benton County | 1 | 1 | 1 |
| Blackford County | 1 | 0 | 1 |
| Boone County | 2 | 3 | 3 |
| Brown County | 1 | 2 | 2 |
| Carroll County | 1 | 1 | 1 |
| Cass County | 2 | 2 | 2 |
| Clark County | 5 | 6 | 7 |
The data on speeding-related fatalities in the top 10 counties emphasizes the need for targeted speed enforcement and education programs. Reducing speeding can significantly lower the number of fatal accidents, improving road safety across these high-risk areas.
Fatalities in Crashes Involving an Alcohol-Impaired Driver by top 10 Counties
Alcohol impairment is a leading cause of traffic fatalities. The table below shows the number of fatalities in crashes involving an alcohol-impaired driver in the top 10 counties in Indiana, highlighting the impact of drunk driving.
Indiana DUI Fatalities by County
| County Name | Total Fatalities (2021) | Total Fatalities (2022) | Total Fatalities (2023) |
|---|---|---|---|
| Adams County | 2 | 1 | 3 |
| Allen County | 10 | 12 | 15 |
| Bartholomew County | 5 | 6 | 4 |
| Benton County | 1 | 1 | 2 |
| Blackford County | 0 | 1 | 1 |
| Boone County | 3 | 2 | 3 |
| Brown County | 2 | 2 | 1 |
| Carroll County | 1 | 1 | 2 |
| Cass County | 3 | 3 | 2 |
| Clark County | 6 | 7 | 8 |
The prevalence of alcohol-impaired driving fatalities in the top 10 counties highlights the critical need for stronger DUI enforcement and public awareness campaigns. Addressing drunk driving through stringent laws and community programs can save lives and enhance road safety.
Teen Drinking and Driving
Teen drinking and driving is a serious concern due to the inexperience and vulnerability of young drivers. The data on teen drinking and driving fatalities calls for targeted interventions such as educational programs, stricter enforcement of underage drinking laws, and parental involvement.
Transportation
On average, the typical Indiana worker spends 22.7 minutes in traffic for their daily commute. This figure is actually a few minutes behind the average commute of the typical U.S. worker, at 25.3 minutes. Only 1.84% of Indiana workers have what are known as “super commutes” beyond 90 minutes.
The top City in Indiana for Traffic Congestion
Not surprisingly, Indiana’s capital city is the top city in the state for traffic congestion The data below was gathered from Numbeo’s 2019 Northern America Traffic Index.
The Top City in Indiana for Traffic Congestion
| City | Traffic Index | Time Index | Inefficiency Index |
|---|---|---|---|
| Indianapolis, IN | 142 | 31 | 192 |
The traffic index column shows the compound index of time used up in traffic because of the average Indiana worker’s commute, including dissatisfaction with the time estimated for traffic and inefficient traffic systems. The time index column is simply the average worker’s commute length, one-way.
The third and final column, the inefficiency index, is the overall estimation of traffic inefficiencies.
According to Numbeo:
High inefficiencies are usually caused by the fact that people drive a car instead of using a public transport or long commute times. It can be used as a traffic component measurement in economies of scale.
Visit Numbeo’s website for additional information.
Now is the time to embark on the road to obtaining cheap car insurance quotes in Indiana to keep all the drivers in your family secure and protected behind the wheel.
By entering your ZIP code below, you can get instant car insurance quotes from top providers.
Frequently Asked Questions
How can I compare car insurance rates in Indiana?
To compare car insurance rates in Indiana, gather your vehicle and driving information, research reputable insurance companies, obtain quotes online or directly, review coverage options, compare prices, check customer reviews, and make an informed decision based on the best combination of coverage and price.
What factors affect car insurance rates in Indiana?
Factors that affect car insurance rates in Indiana include your driving record, age, gender, vehicle type, coverage limits, deductibles, location, credit history, and insurance history. These elements influence how insurers calculate your premium.
Are there any discounts available to lower car insurance rates in Indiana?
Yes, discounts available in Indiana include good driver discounts, multi-policy discounts, good student discounts, safety feature discounts, defensive driving course discounts, and low mileage discounts. These can help reduce your car insurance premiums.
Ready to find cheaper car insurance coverage? Enter your ZIP code below to begin.
What are the specific car insurance requirements in Indiana?
Indiana requires minimum liability coverage of $25,000 for bodily injury per person, $50,000 per accident, and $25,000 for property damage. Uninsured/underinsured motorist coverage of $25,000 per person and $50,000 per accident is also required.
How often should I compare car insurance rates in Indiana?
Compare car insurance rates in Indiana at least once a year or whenever significant changes occur, such as policy renewal, life changes, improvements in your driving record, or changes in the insurance market, to ensure you’re getting the best value.
Read More: How do you get competitive quotes for car insurance?
What should I do if I’m involved in a car accident in Indiana?
If you’re involved in a car accident in Indiana, ensure everyone’s safety, call emergency services if needed, exchange information with the other driver(s), document the scene with photos and notes, and notify your insurance company to start the claims process.
Does Indiana allow usage-based insurance programs?
Yes, Indiana allows usage-based insurance programs. These programs, often known as telematics or pay-as-you-drive, use a device or mobile app to monitor your driving habits. Safe driving behavior can lead to discounts and lower premiums.
Can I get car insurance in Indiana with a foreign driver’s license?
Yes, you can get car insurance in Indiana with a foreign driver’s license. However, it may be more challenging, and you might need to contact multiple insurance companies to find one that offers coverage. It’s often easier if you have an International Driving Permit (IDP).
Read More: Best Car Insurance for Foreigners
How does adding a teen driver affect my car insurance rates in Indiana?
Adding a teen driver to your car insurance policy in Indiana will likely increase your premiums due to the higher risk associated with young and inexperienced drivers. However, you can look for discounts for good students and safe driving to help mitigate the cost.
What should I do if my car insurance policy is canceled in Indiana?
If your car insurance policy is canceled in Indiana, contact your insurance company to understand the reason. Address any issues such as missed payments or required documentation. Shop around and compare quotes from other insurance providers to find new coverage promptly to avoid lapses, which can lead to higher premiums in the future.
By entering your ZIP code below, you can get instant car insurance quotes from top providers.
Free Car Insurance Comparison
Enter your ZIP code below to view companies that have cheap car insurance rates.
Secured with SHA-256 Encryption
Brad Larson
Licensed Insurance Agent
Brad Larson has been in the insurance industry for over 16 years. He specializes in helping clients navigate the claims process, with a particular emphasis on coverage analysis. He received his bachelor’s degree from the University of Utah in Political Science. He also holds an Associate in Claims (AIC) and Associate in General Insurance (AINS) designations, as well as a Utah Property and Casual...
Licensed Insurance Agent
Editorial Guidelines: We are a free online resource for anyone interested in learning more about auto insurance. Our goal is to be an objective, third-party resource for everything auto insurance related. We update our site regularly, and all content is reviewed by auto insurance experts.


